Creative coding
This page will run through some options on how you can make more creative things with your Smart Citizen Kit and data. You have plenty of options!
Doing something creative with the kit?
Make a pull request on the github documentation repository or edit this page.
Making music
 Image credit: jordanmalik, EnviFX 1.0
You can make music with the SCK data! Below some examples following you can use:
Processing / p5
Sometimes, data can be better represented without numbers or graphs. This guide will help you use the famous processing tools for making some creative coding. We will start by configuring a live demo using the Serial port, and then making a simple plot by interacting with the API.
Requirements
For this guide, you will need to get processing from their downloads page.
Rather use p5js?
Check this contributed example by our friend antoine3000
Serial data example
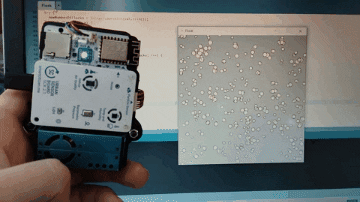
For this example, we will plot data from the Serial monitor (with USB) and use it to animate some circles in processing.
Too lazy to read?
You can find the code used in this tutorial here.
Aknowledgements
The base code for this and more explanations about the Flocks can be found here.
First, you will need to connect your kit to your computer with an USB cable, and find out which port it's connected to. Depending on your configuration you will need to use this sketch:
// Example by Tom Igoe
import processing.serial.*;

// The serial port
Serial myPort;

// List all the available serial ports
printArray(Serial.list());
After running this sketch you will get one or more ports. You will have to select the one that has connected the Smart Citizen Kit. If you are running on windows, you will see something like:
[0] "COM3"
[1] "COM4"
[2] "COM6"
Which one?
This is a notation of an array, where 0 means COM3, 1 means COM4 and so on. We'll need to find which number (index) we need. In this case between 0, 1, and 2.
If you don't know which port the kit is (this is normal in windows), you can use the Arduino IDE or expand the port properties to find out. Normally, it will be listed as Arduino Zero(Native USB Port). Then, use the array index (0, 1, 2 from the example above) that maps to that port.
Now, you can use the example here and run it. Remember to change the PORT_INDEX variable at the beginning of the example:
int PORT_INDEX = 2; //change the 0 to a 1 or 2 etc. to match your port using printArray(Serial.list());
Now, if you hit run! The number of flocks will be equal to the luxes that the kit gets at any given moment. Check it by covering the light sensor with your hand!
Rather see other data?
Find the line in the example where we use the monitor function:
smartCitizenKitSerial.write("monitor light -notime -noms \n");
noise, temp... Once at a time!
You can also make another visualisation with a different background as in this example:

API example
In this case we will asks data to the Smart Citizen API the data and plot it:
Too lazy to read?
You can find the code used in this tutorial here. You can directly run the example and check the output, and you can read below for more details
If you want to modify the example for a different device, find the line where it says:
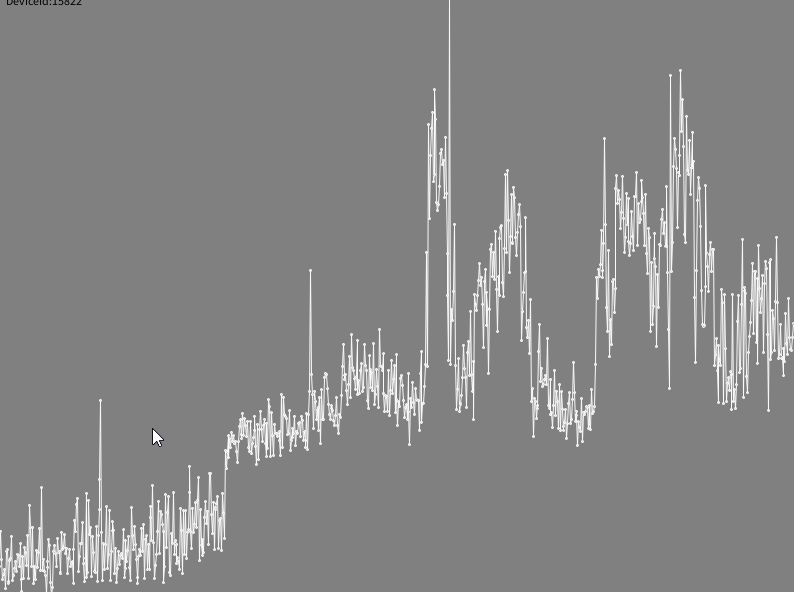
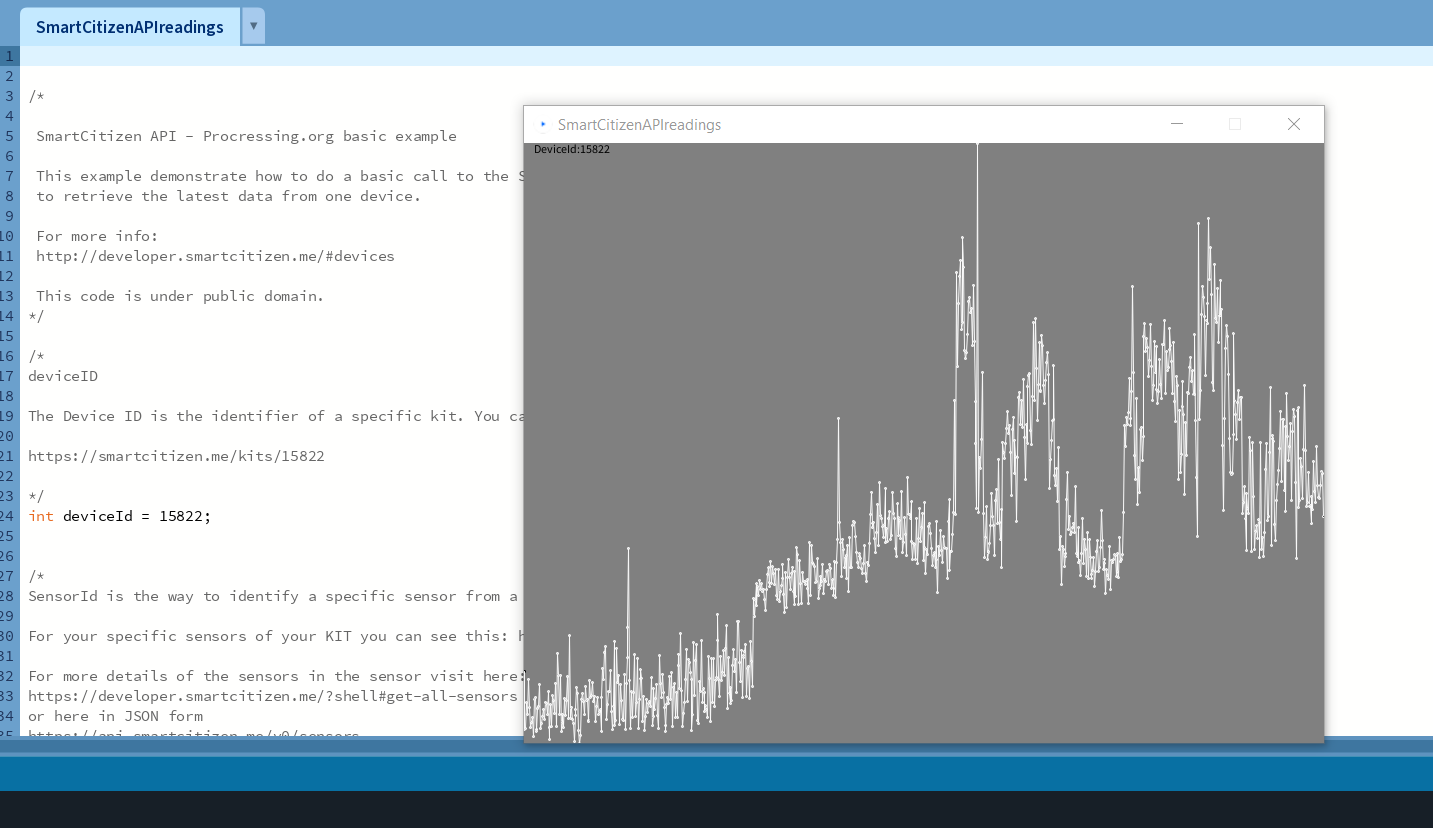
int deviceId = 15822;
And modify it according to your the id of the URL in the map: https://smartcitizen.me/kits/15822. Next, in order to get the measures, we need to pass some extra parameters to the API query (more info here):
-
Roll-up:
int rollUpNumber = 1; String rollUpUnit = "m"; -
Dates
int fromYear = 2023;
int fromMonth = 1;
int fromDay = 11;


int toYear = 2023;
int toMonth = 1;
int toDay = 12;
The final URL is constructed below (note that to is optional):
String resourceURL = "https://api.smartcitizen.me/v0/devices/"+deviceId+"/readings?sensor_id="+sensorId+"&rollup="+rollUpNumber+rollUpUnit+"&from="+fromYear+"-"+fromMonth+"-"+fromDay+"&to="+toYear+"-"+toMonth+"-"+toDay;
// https://api.smartcitizen.me/v0/devices/15822/readings?sensor_id=53&rollup=1m&from=2023-1-11&to=2023-1-12
We will be making the API query in this part:
JSONObject sckData = loadJSONObject(resourceURL);
JSONArray readings = sckData.getJSONArray("readings");  // This contains your requested device info and data.
Processing the data
For more information about this objects here you can find the documentation of processing for JSONArray and JSONObject
The data is stored in a response in JSON that follows a specific structure dictated by the API. You can see it in the API documentation in the response table.
In this sketch we fill a generic array of float numbers using a for loop.
readingsFloats = new float[readings.size()];
for (int i=0; i<readings.size(); i++) {
readingsFloats[i] = readings.getJSONArray(i).getFloat(1);
}
Finally, in order to plot the data, we will find the minimum and the maximum of our range. and then we will create a small dot (elipse 2,2) on each item:
float minValue = min(readingsFloats);
float maxValue = max(readingsFloats);
for (int i = 0; i < readingsFloats.length; i++){
    float x= map(i, 0, readingsFloats.length, 0, width);
    float y= map(readingsFloats[i], maxValue, minValue, 0, height);
    if(i>0) {
        stroke(250);
        line(x,y, map(i-1, 0, readingsFloats.length, 0, width),map(readingsFloats[i-1], maxValue, minValue, 0, height));
    }
    ellipse(x, y ,2,2);
}
And this is the result!