Live demos
This guide is meant to show some possibilities for you to do live demos with data. There are plenty of ways to do it, but in this guide we will focus on the following:
- Through the Serial (USB), either with Arduino IDE Serial Monitor (simple) or with SerialStudio (more configurable plots)
- Via the online web dashboard available at dashboard.smartcitizen.me, useful for long-term displays
Using Serial Tools
In this case, we will need a computer with either the Arduino IDE or SerialStudio. These tools will be used to plot the data coming from the kit (only one kit at a time), which will be connected via USB with a computer.
Feeling creative?
If you rather use a more creative approach, you can follow this guide for using processing to make these visualisations.
Arduino IDE
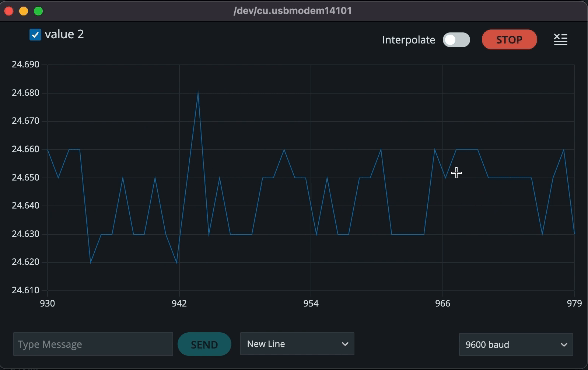
After Arduino 2.0 version, you can see the Serial Monitor and the Serial Plotter at the same time. This is very useful to interact with the kit and see the data in real time, so we recommend upgrading to Arduino 2.0 for this. If not, you can always use Arduino 1.8.*, but you'll have to switch back and forth between the Serial Monitor and the Serial Plotter.
Using the Shell
If you are not familiar with it yet, make sure you check the Shell Guide before the next steps.
Step-by-step
- Connect to your SCK via the Port selection
- Open the Serial Monitor and type in the monitor command (avoiding the milliseconds and timestamp columns with the
-nomsand-notimeoptions). In this example we will check the temperature by issuing the following command:monitor -noms -notime temperature - Open the Serial Plotter and enjoy a nice looking graph!
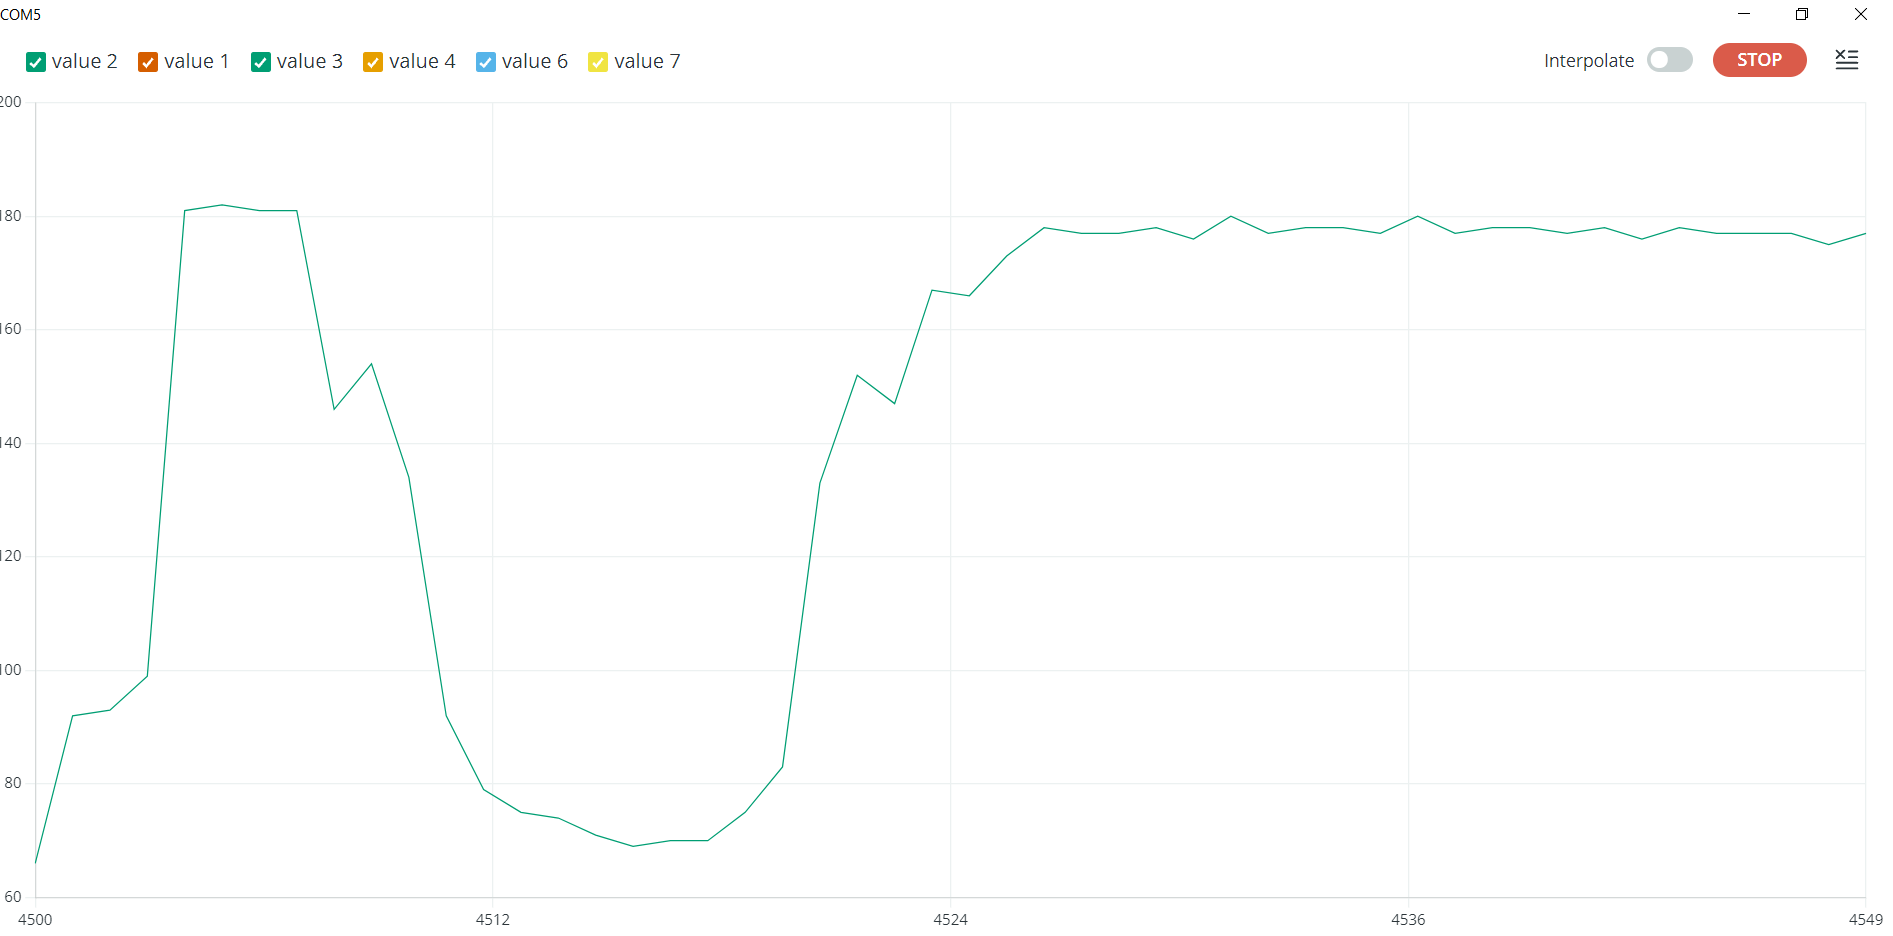
SerialStudio
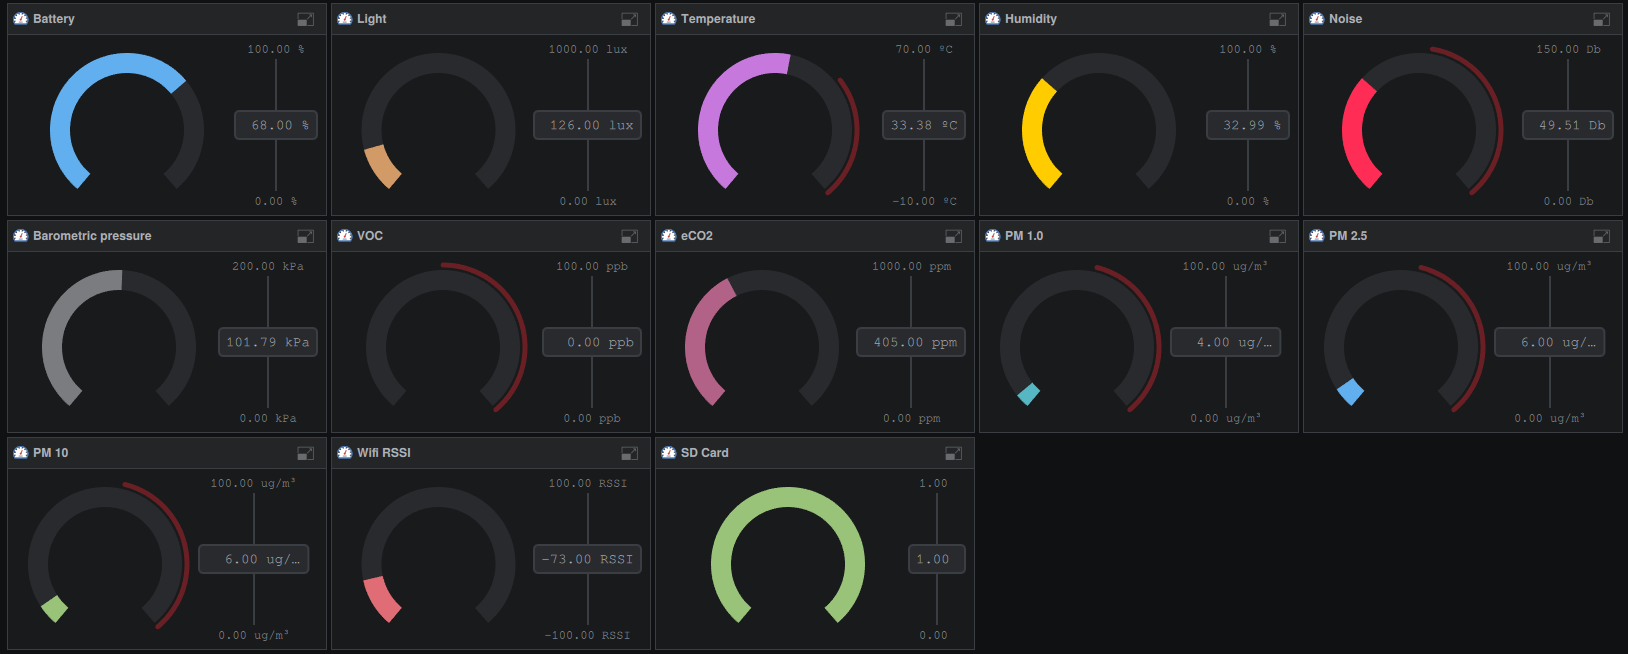
SerialStudio is a great tool for visualising data and make dashboards with your kit connected to a computer. It's more advanced than the Arduino Serial Monitor because you can customise how your data will be displayed, add graphs, widgets, and save the configuration for each device.
Examples
You can see the examples here
Using the web dashboard
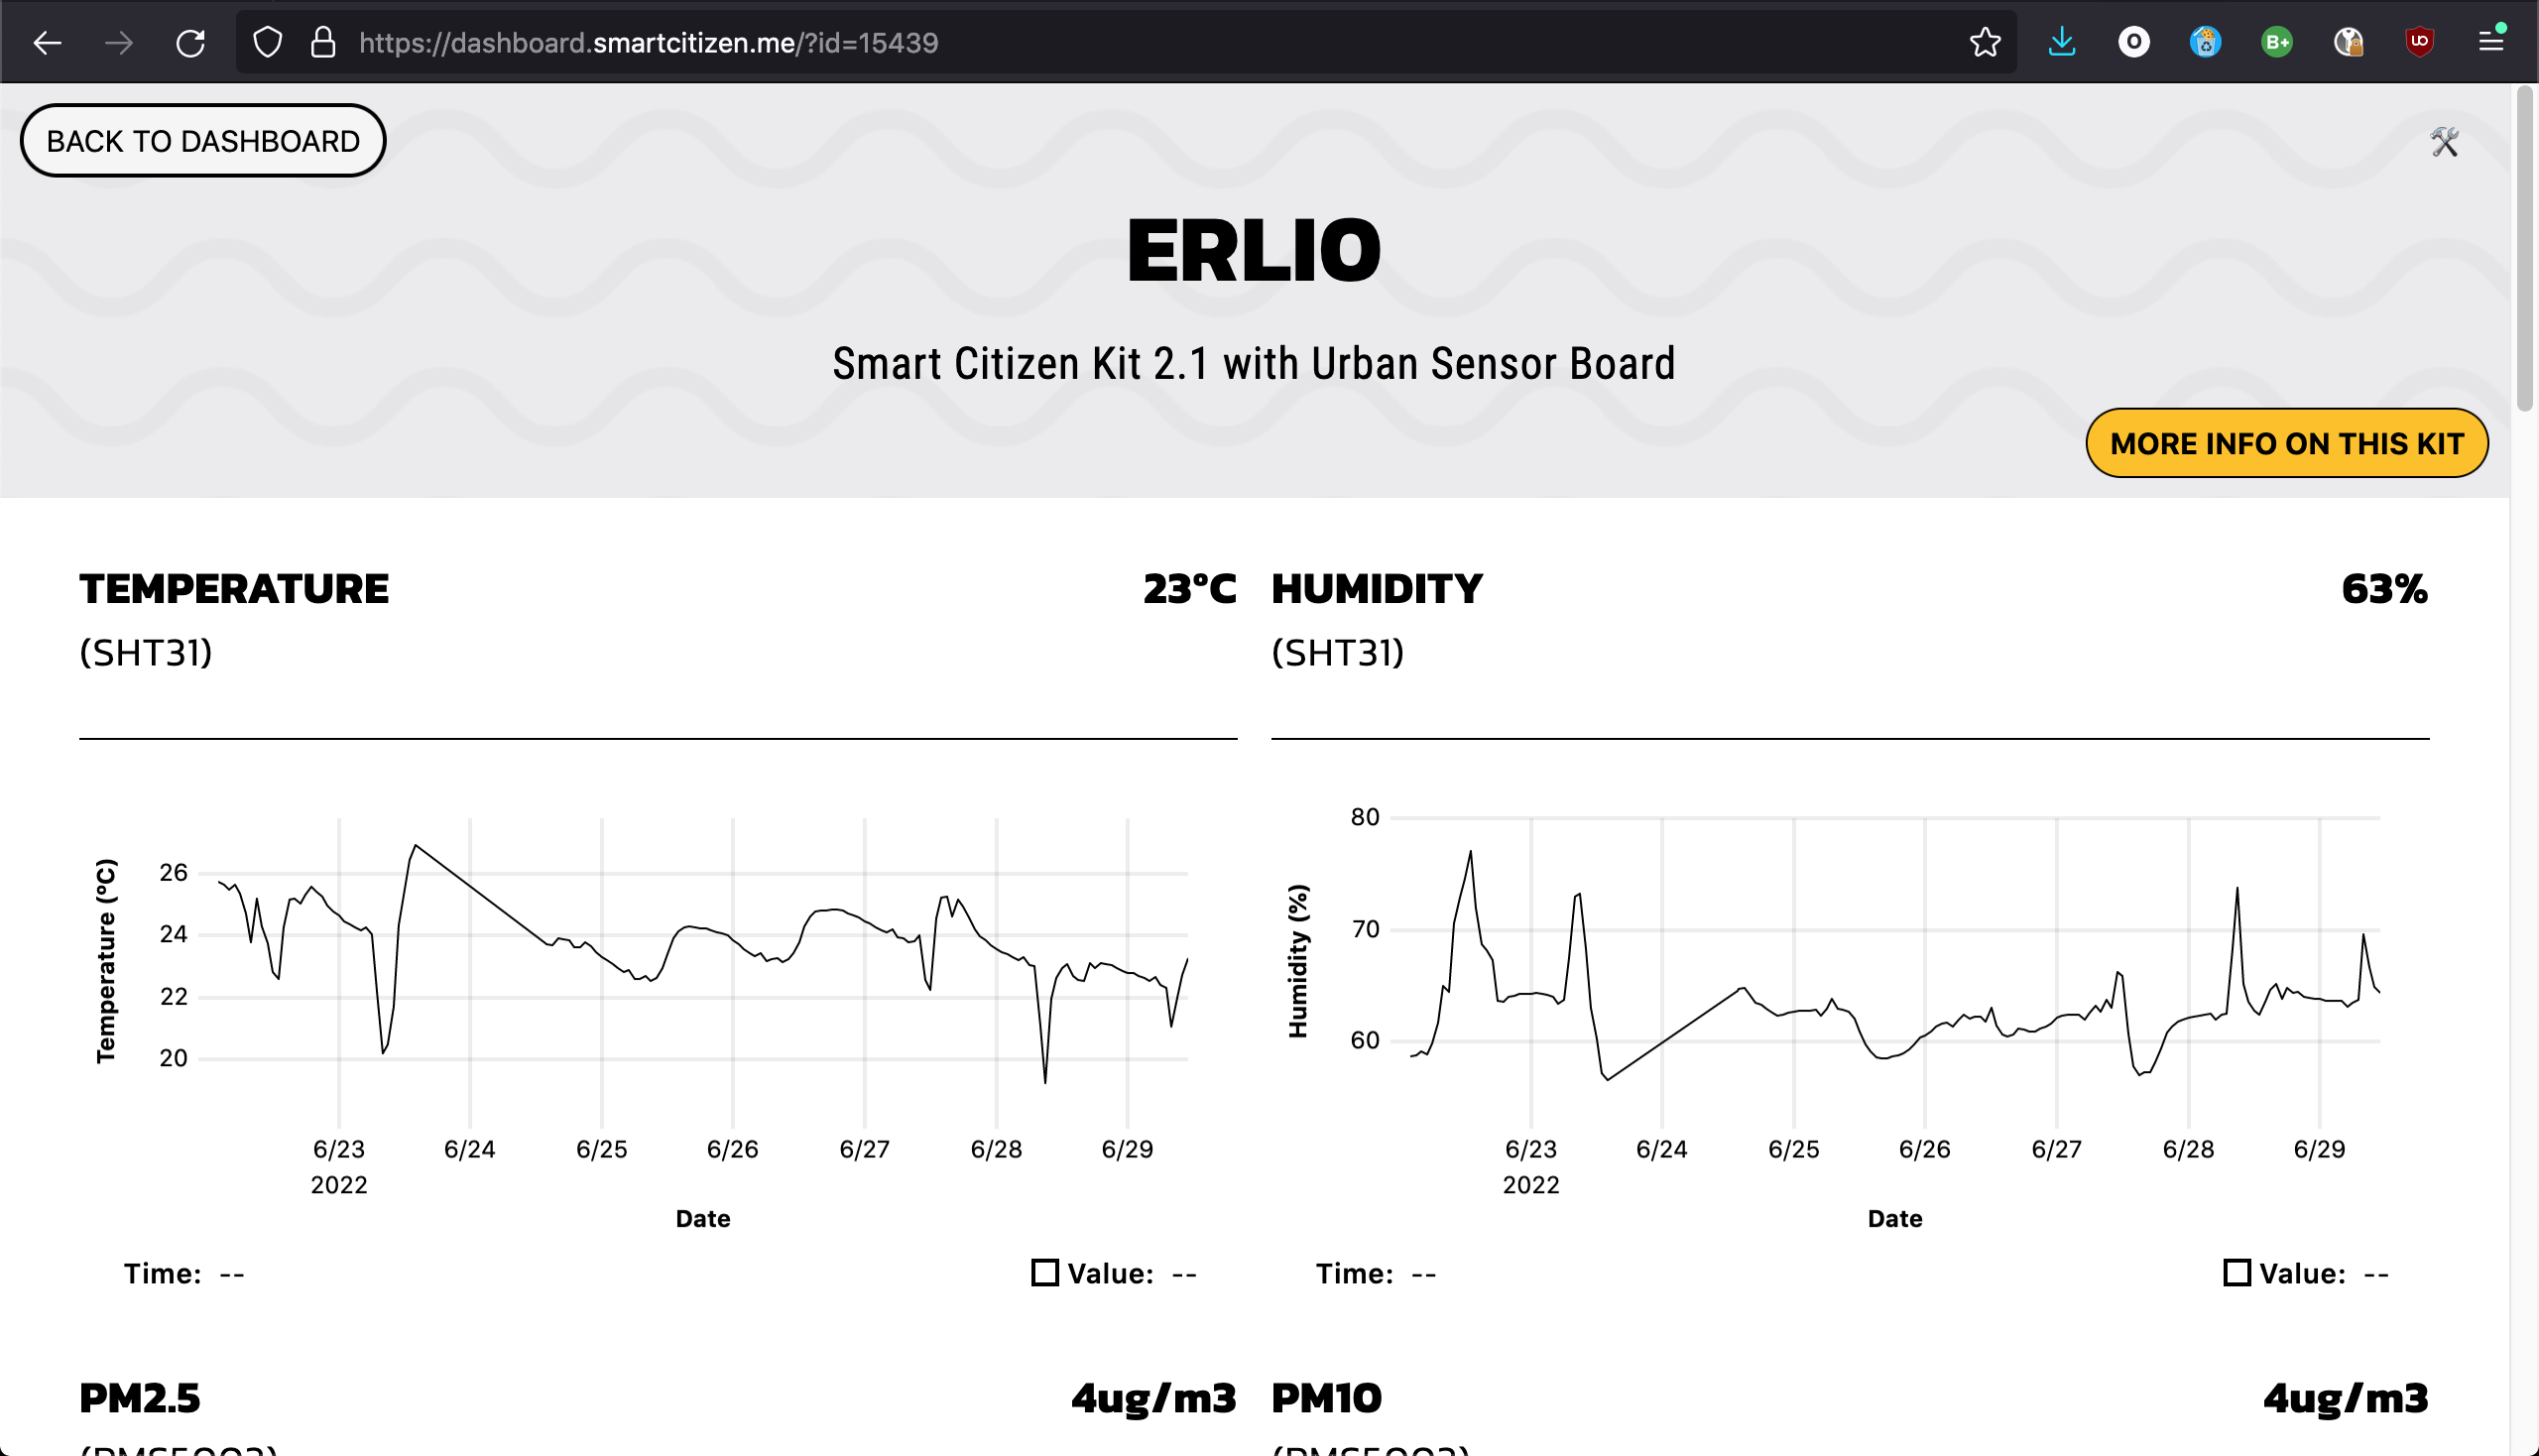
For this, you can visit the dashboard with a particular ID. For instance, this device.
You can toggle some options on the side menu, but by default you will have the Auto Update check active. If the kit you are checking is sending data, updates should come little by little.
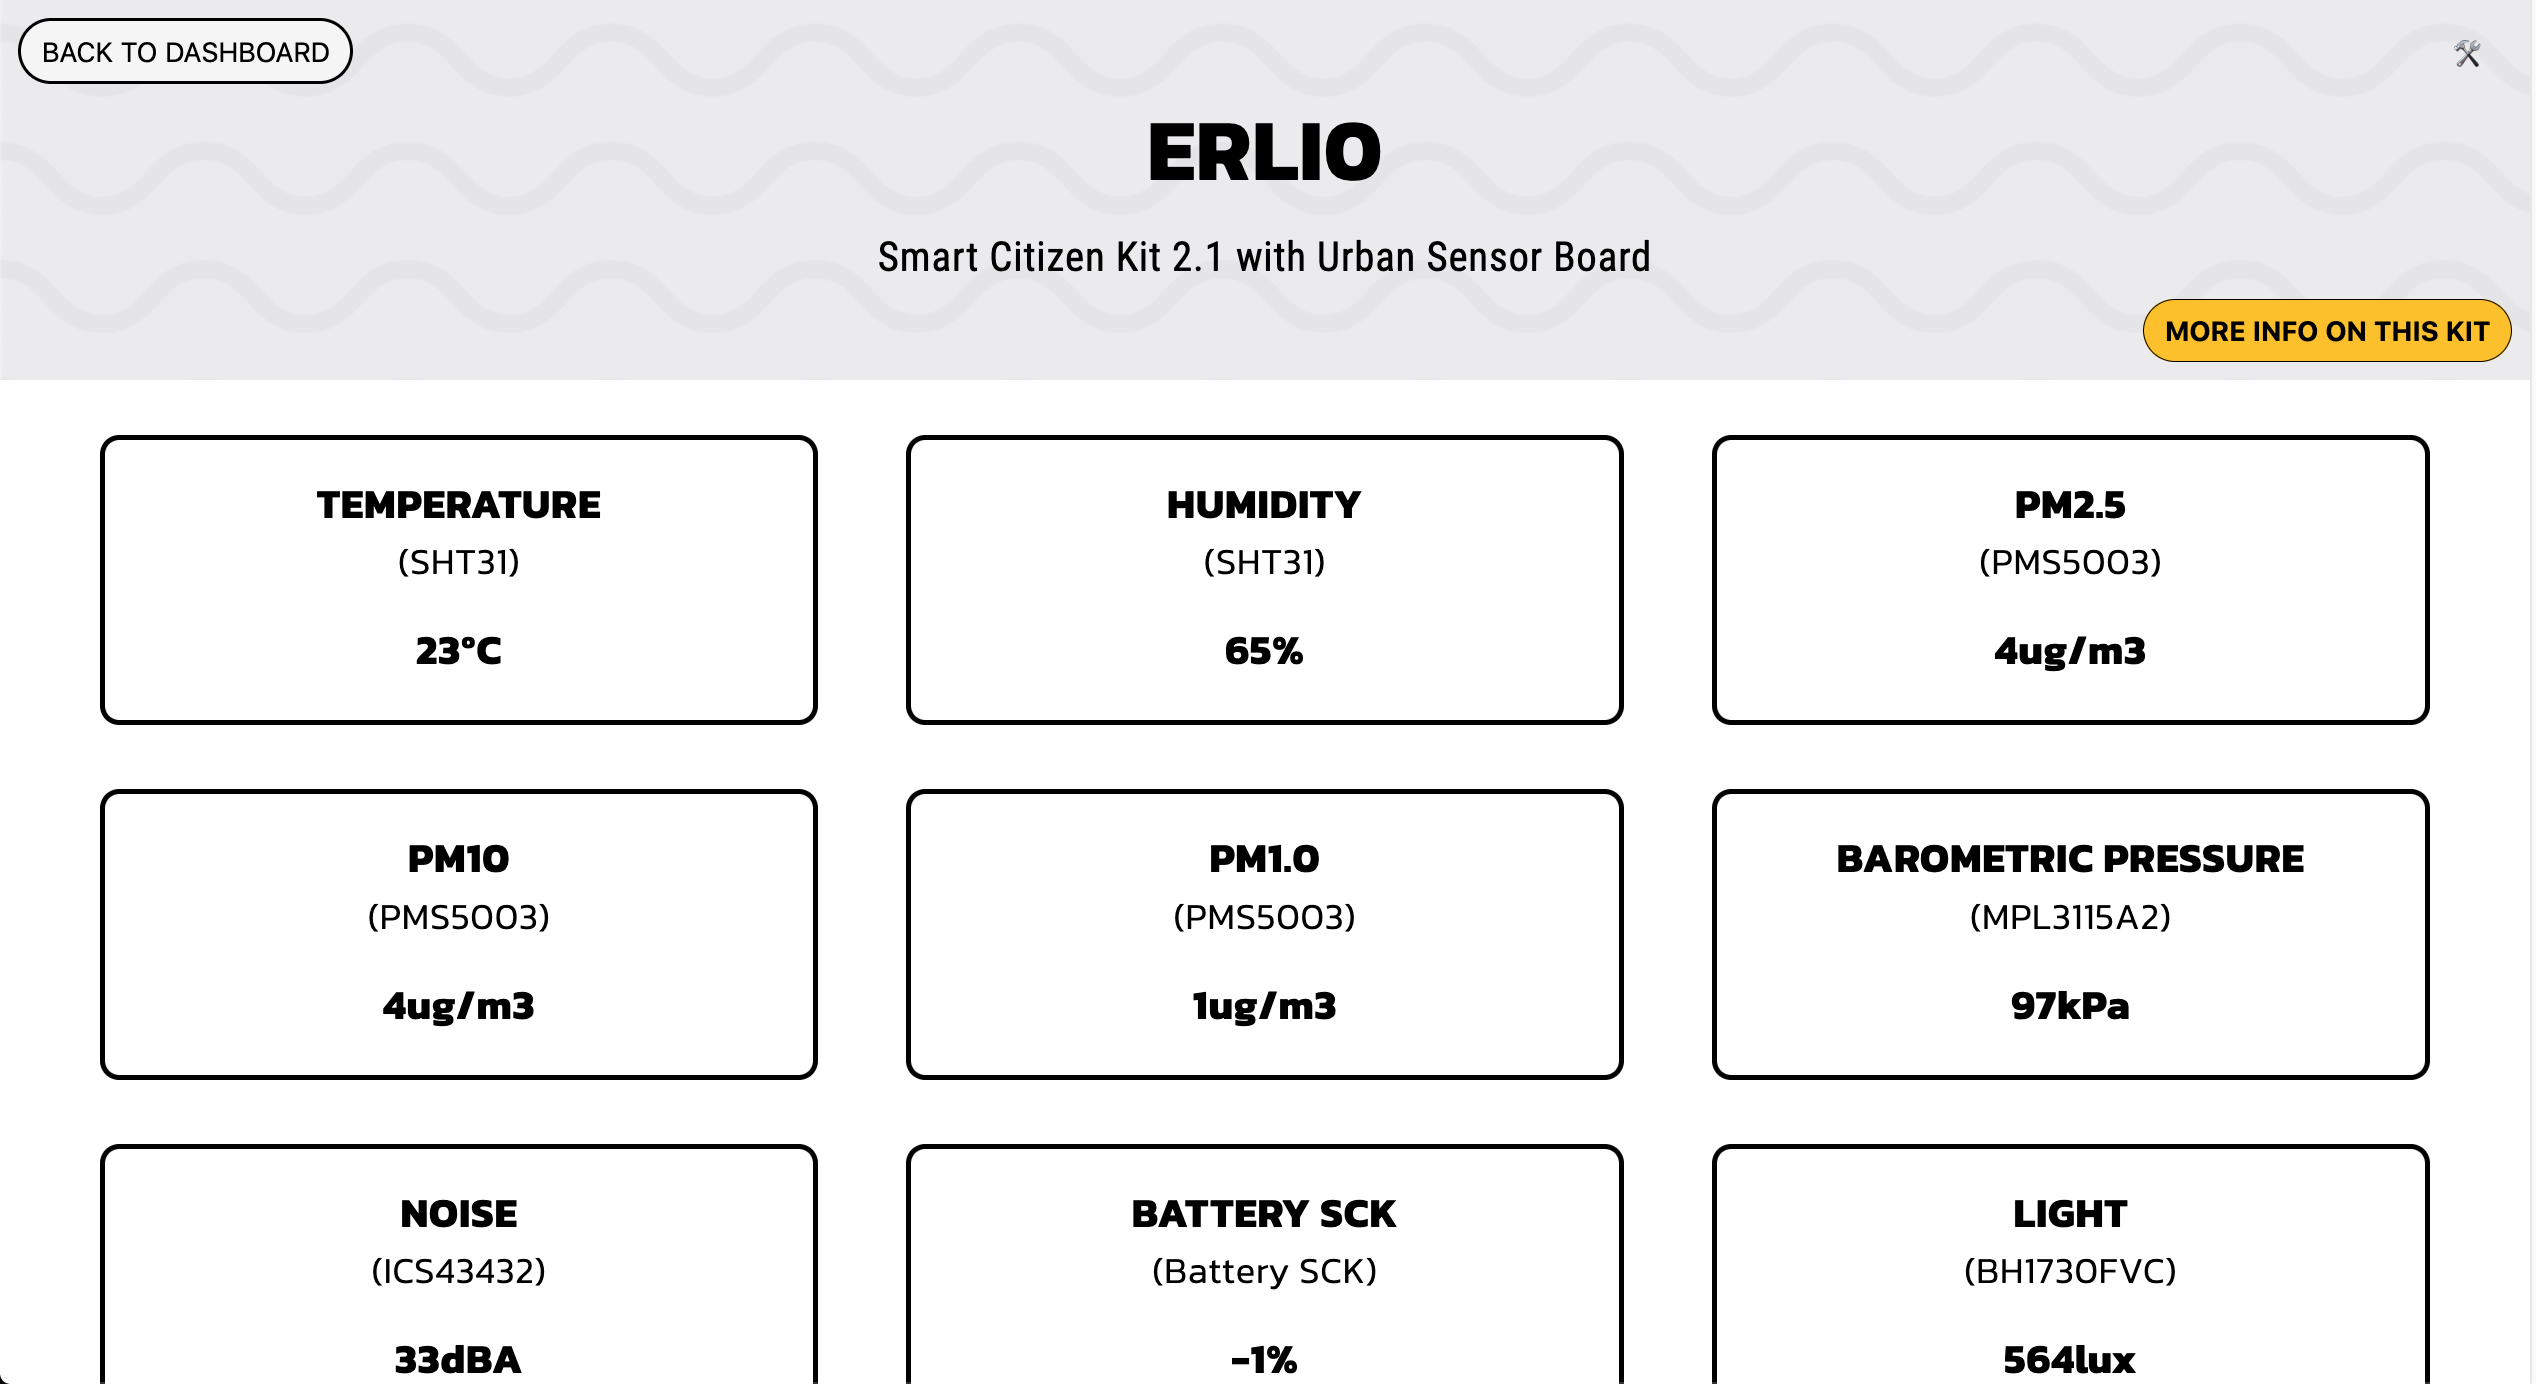
No graphs? No problem!
If you don't want to see the graphs on the dashboard, you can remove them by deactivating the Show Graphs on the side pannel. This will leave a neat view of the sensors. You can also choose which sensors, and their order, to clean up the view in case your kit has many sensors connected.
In case you want to change the interval, so that data comes in more frequently, you can do so by Using the Shell. To avoid checking that guide again, this is the command to issue if you want to read and publish the sensors every 5 seconds (which will send updates very quickly, although with a bit of delay because data needs to fly from your kit to the platform):
config -readint 5 -pubint 5
When you are done, make sure you reset the reading and publication interval back to normal, to avoid cluttering our beloved platform with unnecessary data and to drain your kits battery
config -readint 60 -pubint 180