Data Tools

When dealing with sensor data, specially with low cost sensors, a great part of the effort needs to be dedicated to data analysis. After a careful data collection, this stage of our experiments is fundamental to extract meaningful conclusions. For this reason, this section is a compilation of tools for making sense of the data. Some of them are custom made, and others are general purpose tools that can be adapted for the Smart Citizen use case. Check them below, and head out to the guides for more step-by-step documentation on each!
Pen and paper
Probably the best way to get started in data analysis by using simple tools for comparing data and extracting insights. Time-series plots can be printed in large sheets of paper, and can then be compared with each other by drawing onto transparency paper.
Basic, but insightful!
This tool, even if seemingly very basic, allows you to work with data and share insights with others very quickly. For instance, while working with the Plaça del Sol Community in Barcelona, we learnt that the noise patterns in social areas are, on average, not as loud as other traffic areas, but that the peaks of the noise are what cause the biggest concerns. From that we learnt that the regulation of noise in public spaces is not really representative for these areas, and that even if on average the readings are below the limits, sometimes the place is unlivable!

How to make them?
Soon you will be able to generate the files for printing from the web dashboard. In the meantime, you can check this tutorial in python
Source files
Paper charts on the Smart Citizen Toolkit: https://github.com/fablabbcn/smartcitizen-toolkit/tree/master/pen-and-paper Pen and Paper with python scripts: https://github.com/fablabbcn/smartcitizen-data/blob/master/examples/notebooks/13_pdf_largescale_plots.ipynb
Web tools
Web tools do not require any installation, and for that they are very easy to use (almost) everywhere. Normally data is directly requested via the API, but in some cases you can also load a CSV file. However, this ease of use comes at a cost: many of the tools are not very flexible, and different visualisations are not possible, or integrations with our API is not always complete. Nevertheless, they normally require zero setup, so you can get started in no time!
Some examples you can check out:
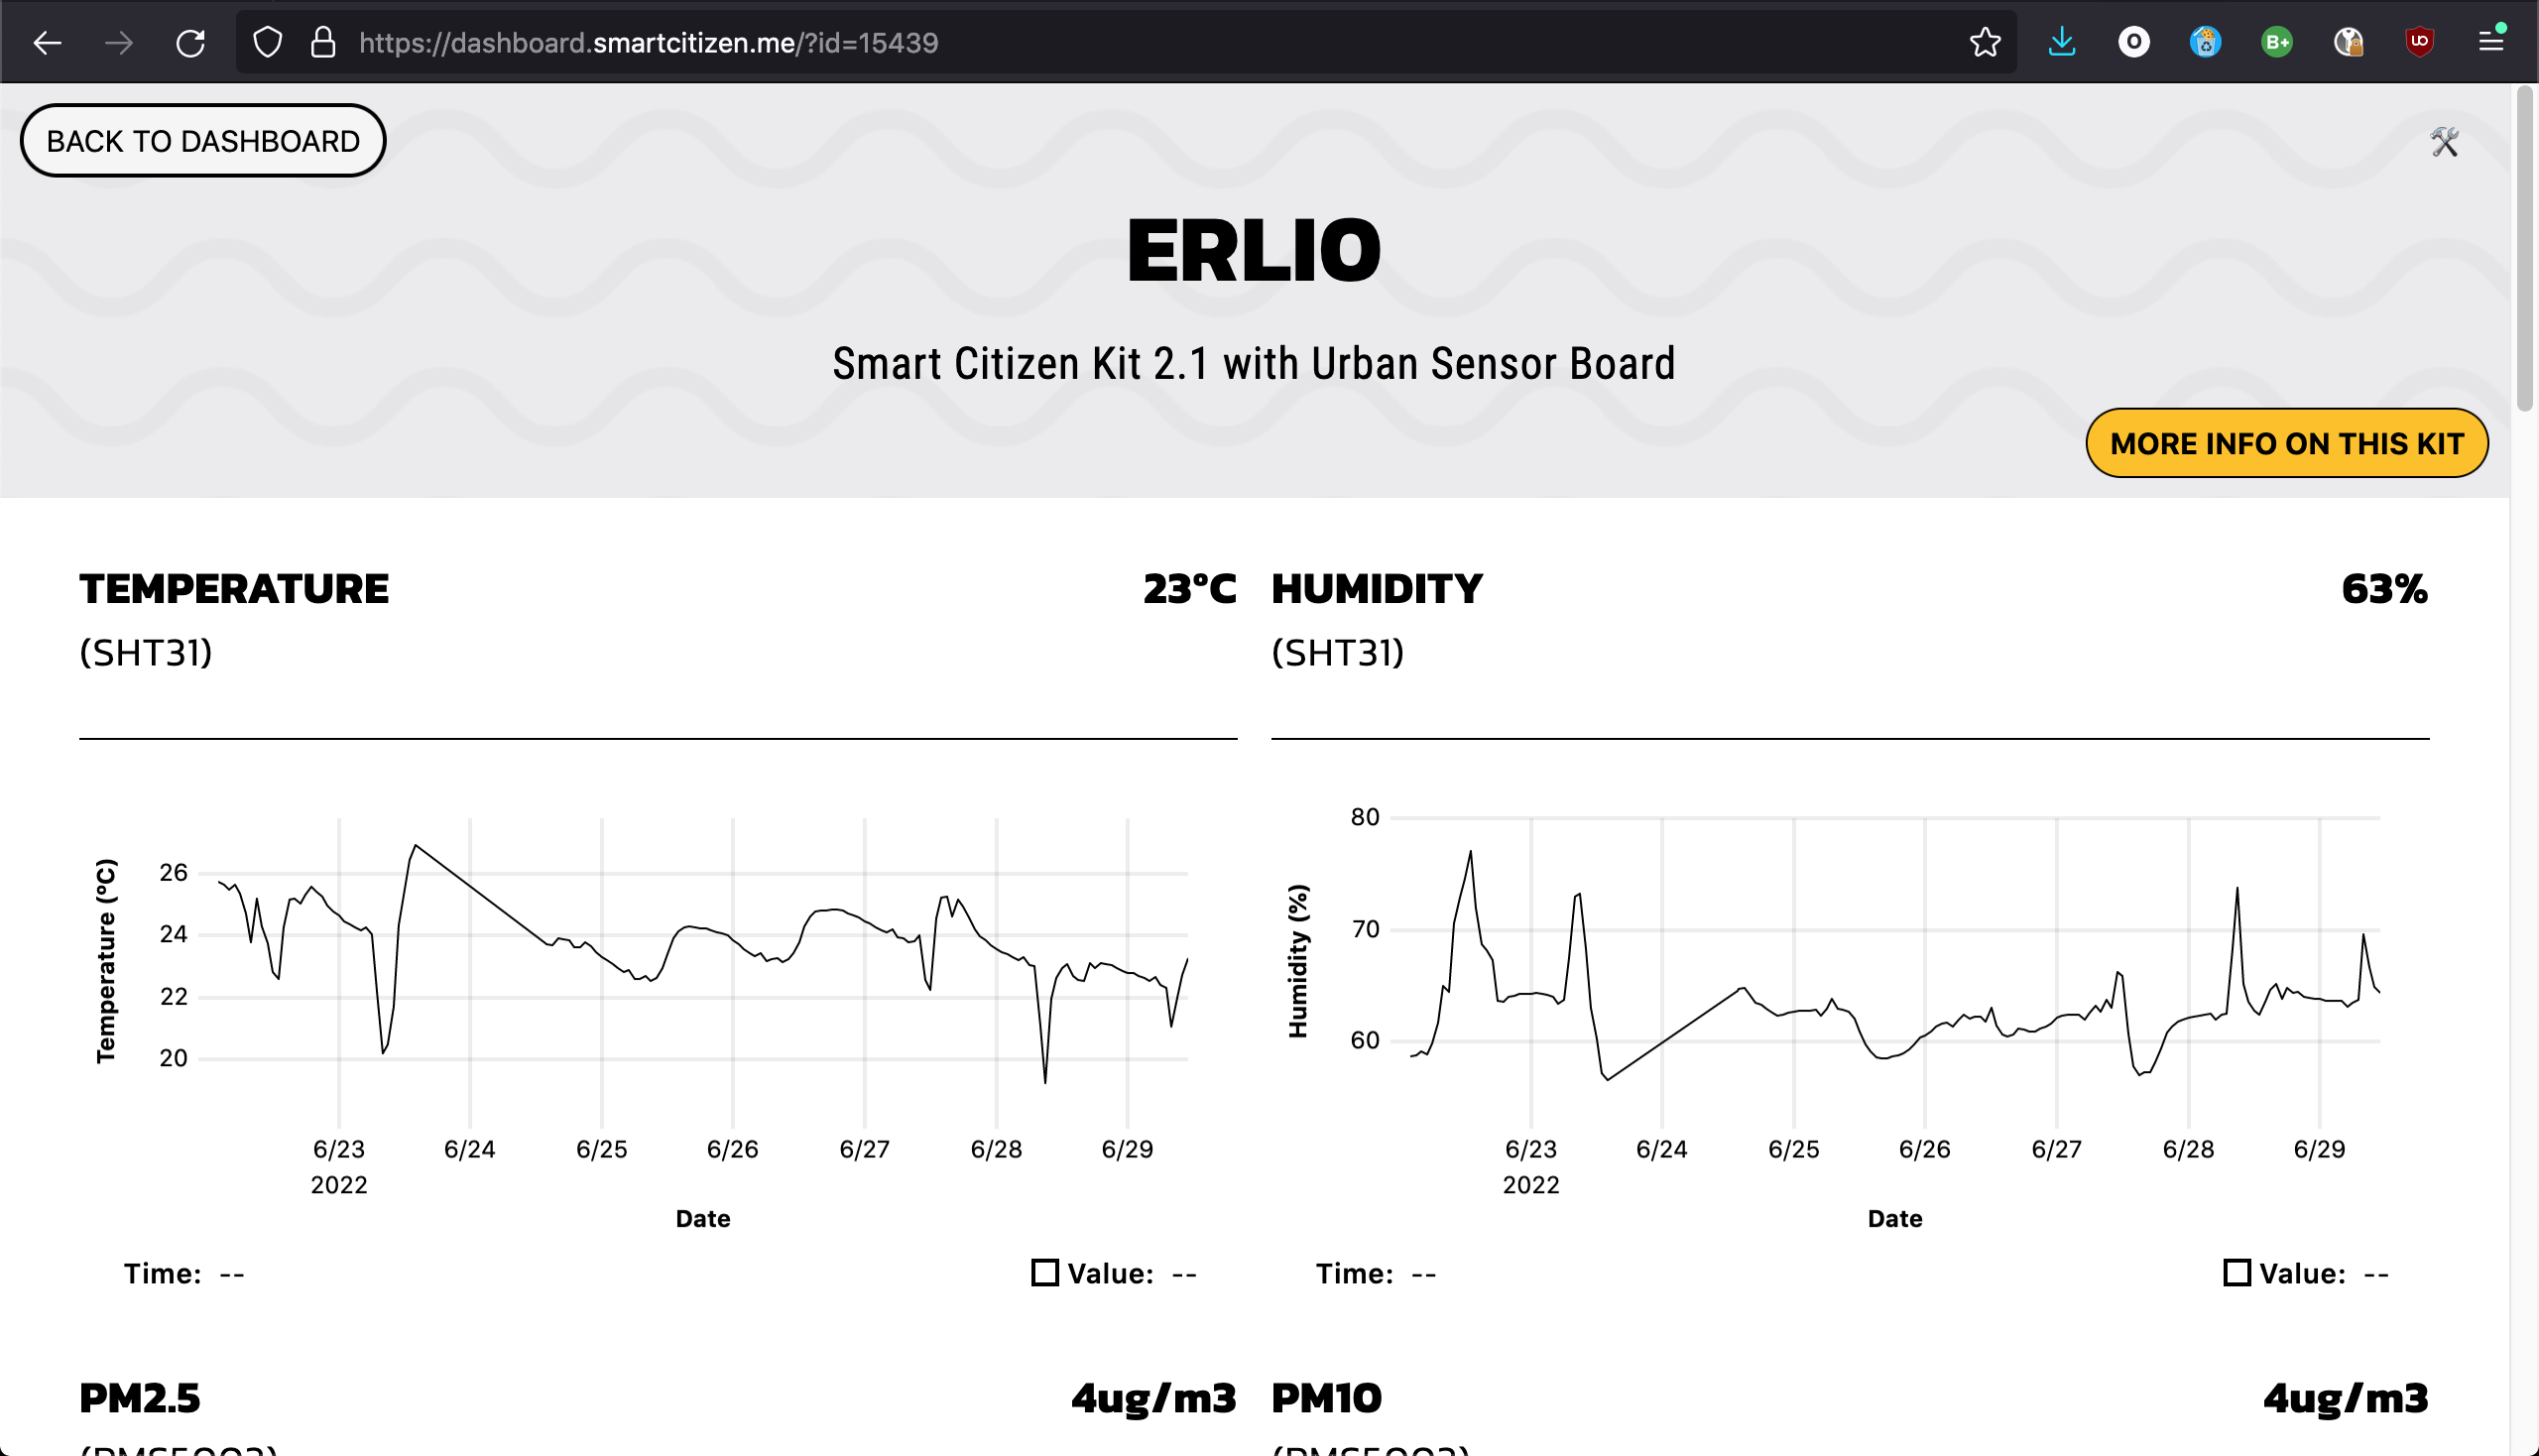
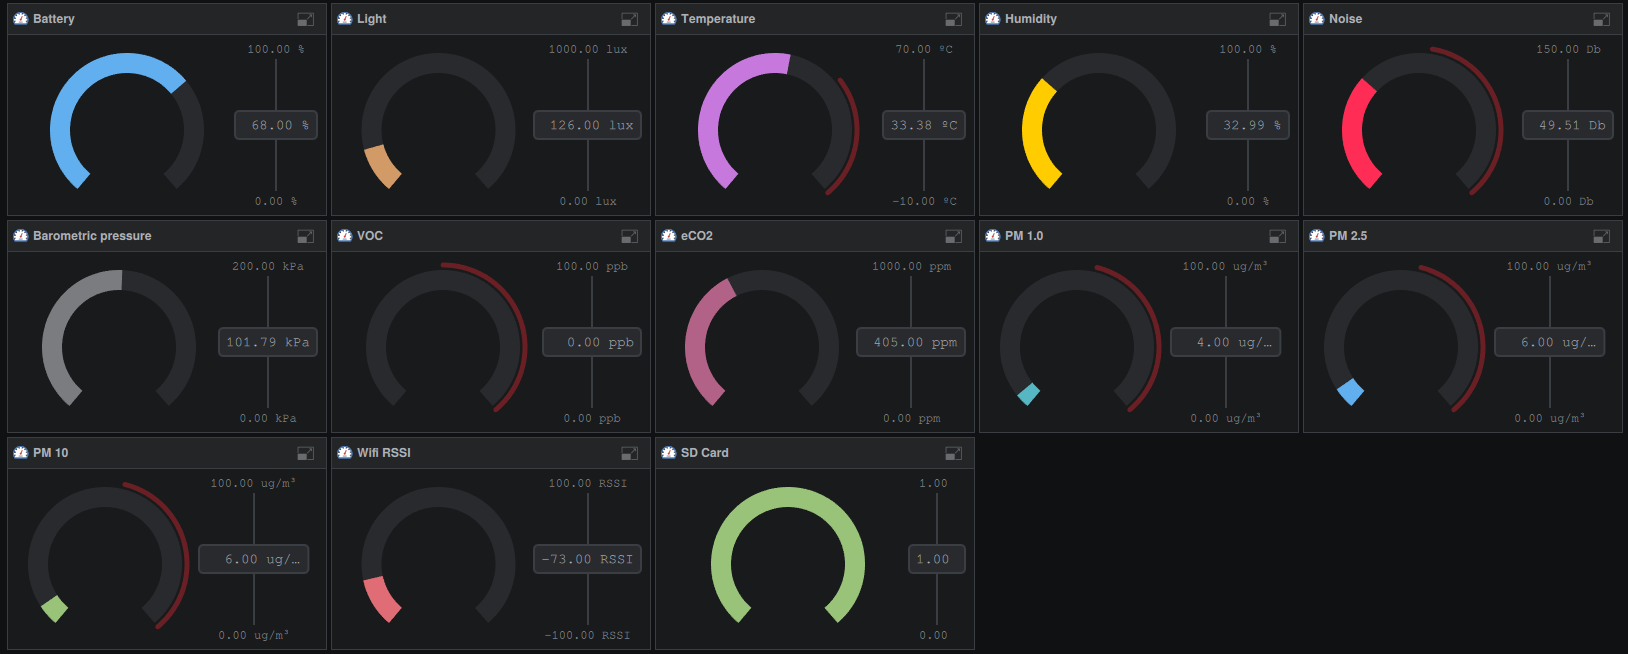
- Smart Citizen Map: the classic map, with simple time-series plots and comparisons between metrics from one device
- Smart Citizen Dashboard: a basic dashboard, written in javascript, that can show all the devices, their status, and allows for filtering based on location and tags. It also features a basic time-series plot with customisable time-frame, websockets notifications, and data download in CSV, from any device!
- RawGraphs: an open source web based visualisation tool, based on D3, that can interact with data from a CSV file (and maybe from our API sometime soon)
- Binder: a web based notebook tool for more advanced data analysis. See below in the advanced section
More?
More tools can be found in the toolkit repository. You can check some of them as well on the Creating interfaces Guide.
Source files
- Smart Citizen API: https://api.smartcitizen.me
- Smart Citizen Web: https://github.com/fablabbcn/smartcitizen-web
- Smart Citizen Dashboard: https://github.com/fablabbcn/smartcitizen-dashboard-js
- Onboarding App: https://github.com/fablabbcn/smartcitizen-onboarding
Live demos
Live demos can help show how sensors work or how they react to different events: for instance, how PM data changes when you put a candle near the kit, even if you can't see the smoke, or how temperature rises when you touch the temperature sensor.
For you to be able to do these experiments, you need high speed data (i.e. data that is updated way faster than once a minute on a web dashboard). To help with that, we have prepared a specific guide for Live Demos, so make sure to check it out!
Source files
Live demos: https://github.com/fablabbcn/smartcitizen-toolkit/
Creative coding
Sometimes visualising data is more impactful when using creative visualisations that do not have numbers or graphs on them. seCreative coding refers to those tools that generate some short of data visualisation, but that is not done in the conventional way, but more on an artistic way.
A good example to get started is processing or it's web version p5. Both are simple to use if you want to learn how to code in a fun way, they are full of examples, and very well documented. Also, you can make music based on your kit's data with supercollider.
Examples
You can find some examples in the guides!
Visual programming
Needing to get more advanced insights, but not wanting to program them? Visual programming tools can help you get started. They are midway between web tools (with no installation, but not very flexible) and more advanced tools (installation and flexibility is full on). Here you will need to install something, as they normally require libraries and other background processes to run in your computer. However, that initial process comes with loads of good things, for instance, the ability to use generic data analysis tools with our data.
Some examples are below:
- Node-RED is an open-source visual tool that enables the connection between hardware devices, APIs and online services. The tool can be easily installed on any local computer or even an inexpensive Raspberry Pi single board computer.
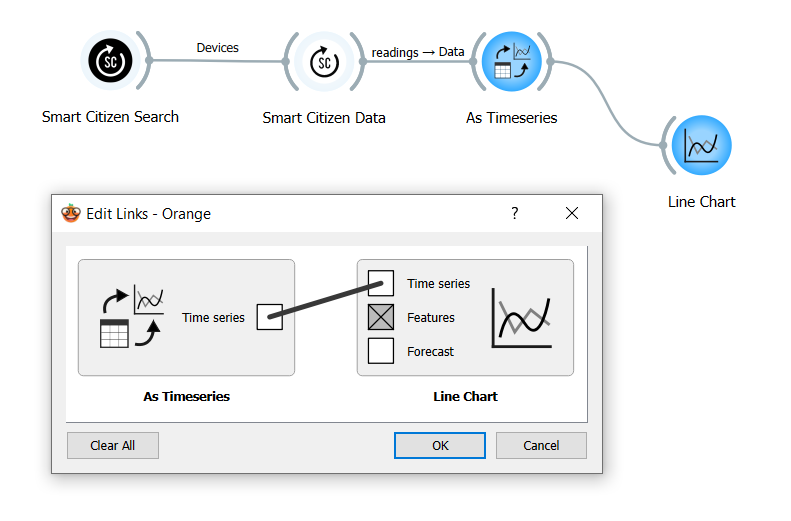
- Orange - an open source tool for data analysis. As part of a collaboration with Cos4Cloud MECODA, you can also access Smart Citizen data from this great tool with a few clicks.
Orange workflows
If you want to use some existing workflows, you can visit the Orange Workflows Repository https://github.com/fablabbcn/smartcitizen-docs/tree/master/docs/assets/ows
Also, a lot of step-by-step tutorials will help you use it in any use case (also in educational contexts!)
Advanced
Here we go, this is the most advanced and flexible tool of them all: a data analysis package written specifically to interact with several APIs, including of course the Smart Citizen API, and to perform all the operations needed for doing advanced data analysis. Leveraging on the power of python and all it's associated tools, scdata is a package that can be easily installed on any computer with a simple pip install scdata. It is intended to provide an state-of-the art data analysis environment, adapted for the uses within the Smart Citizen Project, but that can be easily expanded for other use cases. The ultimate purpose of the framework is to allow for reproducible research by providing a set of tools that can be replicable, and expandable among researchers and users alike, contributing to FAIR data principles. Ultimately, it uses normal pandas dataframes that can be passed to any plotting, modelling or numerical analysis library in python.
![]()
![]()
![]()
More familiar with R?
R users won't be left stranded. RPY2 provides functionality to send data from python to R quite easily. Also, you can download this R library to access data from R!
We care for open (science)
Our concept of open science might differ from others in fundamental way. It does not go on the hype that many people advocate for to simply make business with it. We think that free and open source development practices are fundamentally applicable to any aspect of knowledge and research, and also to open science by default, at least the way we understand it. For us, this means that data that can be accessible through open apis without any restriction, reproducible by providing all the information and tools on how the data is processed from raw to final format, findable with unique, unmutable, identifiers in open dataset repositories such as zenodo. You will be wondering about interoperable: this last one probably will take more time, but hopefully we will get there one day if we all agree on what this all means.
The framework integrates with the Smart Citizen API and helps with the analysis of large amounts of data in an efficient way. It also integrates functionality to generate reports in html or pdf format, and to publish datasets and documents to Zenodo.
Raw and processed data
All the raw sensor data from the devices is sent to the Platform and processed outside of the sensors. Raw data is never deleted, and the postprocessing of it can be traced back to it's origin by using the sensor blueprint information. This way, we guarantee openness and accesibility of the data for research purposes.
Check this guide to learn more about how we postprocess the data of the sensors and how to make it your own way.
This is the tool that probably has the largest amount of examples and use cases:
- Guides will help you to install the framework and start using it!
- Scripts and Notebook Examples is a compilation of examples ready to get hands on with the data
Source files
- Smart Citizen Data (python): https://github.com/fablabbcn/smartcitizen-data
- Smart Citizen Data (R): https://github.com/fablabbcn/smartcitizen-R-data
- Smart Citizen Connector (python): https://github.com/fablabbcn/smartcitizen-connector
- Smart Citizen Flows: https://github.com/fablabbcn/smartcitizen-flows