Debug the firmware
Introduction
Sometimes (many times actually), our code won't do what we want it to do and we need to take a look at what it's doing. By using a debugger we will be able to see what is going on inside another program while it executes or even crashes. This is fairly straight forward when you code for a modern day computer, since most IDEs have a proper interface integrated for it. However, debugging a chip like the SAMD21 can sometimes be tricky and here is where it's interesting to use a debugging kit.
To keep it simple: our final target is to be able to interact with the SAMD21 (or the chip) while it's executing the program and tell it to pause the execution, give us the value of some variables and then continue. We will release a fairly extensive report with documentation on this process, but for those interested in reading an overview on how to debug, this post can be a short introduction.
So, here we go! The first item we need is the Open On-Chip Debugger (OpenOCD) which provides debugging with the assistance of a debug adapter. This adapter is a small hardware module which helps provide the right kind of electrical signaling to the target being debugged. These are required since the debug host, on which OpenOCD runs (i.e. your computer, a Raspberry PI...) won’t usually have native support for such signaling, or the connector needed to hook up to the target.
These adapters are sometimes packaged as discrete dongles, which may generically be called hardware interface dongles (and are quite expensive). Some development boards also integrate them directly, which may let the development board connect directly to the debug host over USB (and sometimes also to power it over USB, like the Arduino Genuino Zero). In the case of the Smart Smart Citizen Kit, we have a SWD Adapter that supports Serial Wire Debug signaling to communicate with the ARM core. In our approach, using a complete open toolchain, OpenOCD is be running on a Raspberry Pi, and communicating with the SCK's SWD through the GPIO pins of the Pi.
Finally, to be able to actually see what is going on inside our firmware while it executes, we need something that is able to read and understand the machine code and hand it over to a human understandable interface. This is where GDB kicks in and helps us by:
- Starting our program, specifying anything that might affect its behavior.
- Make our program stop on specified conditions.
- Examine what has happened when our program has stopped.
- Change things in our program, so we can experiment with correcting the effects of one bug and go on to learn about another.
GDB and OpenOCD will be running in a Raspberry Pi hooked up to the SWD interface of the SCK, and we will see what's going on in them from our computer's terminal via SSH. Fairly simple, right? Now, we can make some changes to our code, make GDB flash it to the SCK and keep debugging in a completely open toolchain!
Debugger setup using a Raspberry Pi
-
First download and copy Raspbian Lite to your SDcard, here are the installation docs.
-
Add wifi configuration
Create a file name
wpa_supplicant.confon the/bootpartition of the SD card, the content of this file should looks like this:Replacing wifi_ssid and wifi_password with your actual wifi network information. The wpa_supplicant.conf file will be copied to /etc/wpa_supplicant/ directory automatically once the Raspberry Pi is booted up.ctrl_interface=DIR=/var/run/wpa_supplicant GROUP=netdev update_config=1 network={ ssid="wifi_ssid" psk="wifi_password" } -
Enable SSH server.
SSH access is disabled as default for security reasons. To enable the SSH server when Raspberry Pi is booted up for the first time: create a file called
sshwith no file extension and no contents, and copy it to the/bootpartition on the SD card. -
Find your raspberry on the network
In order to find a raspberry pi over the network we can use commands like these:
Linux
MY_IP_RANGE=$(ip addr | grep 'state UP' -A2 | tail -n1 | awk '{print $2}') && nmap -sn $MY_IP_RANGE && IP=$(arp -na | grep b8:27:eb | grep -Eo '[0-9]{1,3}\.[0-9]{1,3}\.[0-9]{1,3}\.[0-9]{1,3}') && ssh $IP;
Mac
MY_RANGE=$(ip addr | grep "UP" -A3 | grep '192' -A0 | awk '{print $2}') && nmap -sn $MY_RANGE && arp -na | grep b8:27:eb
-
SSH login without password:
- If you have never generated a RSA key:
ssh-keygenwithout passphrase - Copy the key to the Raspberry:
ssh-copy-id -i ~/.ssh/id_rsa.pub raspi-address
Once booted, it will connect to the network. The command above (
MY_IP...) finds it and logs into it via SSH. - If you have never generated a RSA key:
Once you are logged to your raspberry pi and connected to the internet, do a system upgrade:
sudo apt-get install rpi-update
sudo rpi-update
sudo apt-get update && sudo apt-get dist-upgrade
sudo apt-get install git autoconf libtool make pkg-config libusb-1.0-0 libusb-1.0-0-dev telnet sshfs
Openocd installation
- Clone openocd repository and compile:
git clone git://git.code.sf.net/p/openocd/code openocd-code
cd openocd-code
./bootstrap
./configure --enable-sysfsgpio --enable-bcm2835gpio
make
sudo make install
The list of interfaces that openOCD can use is under: /usr/local/share/openocd/scripts/interface.
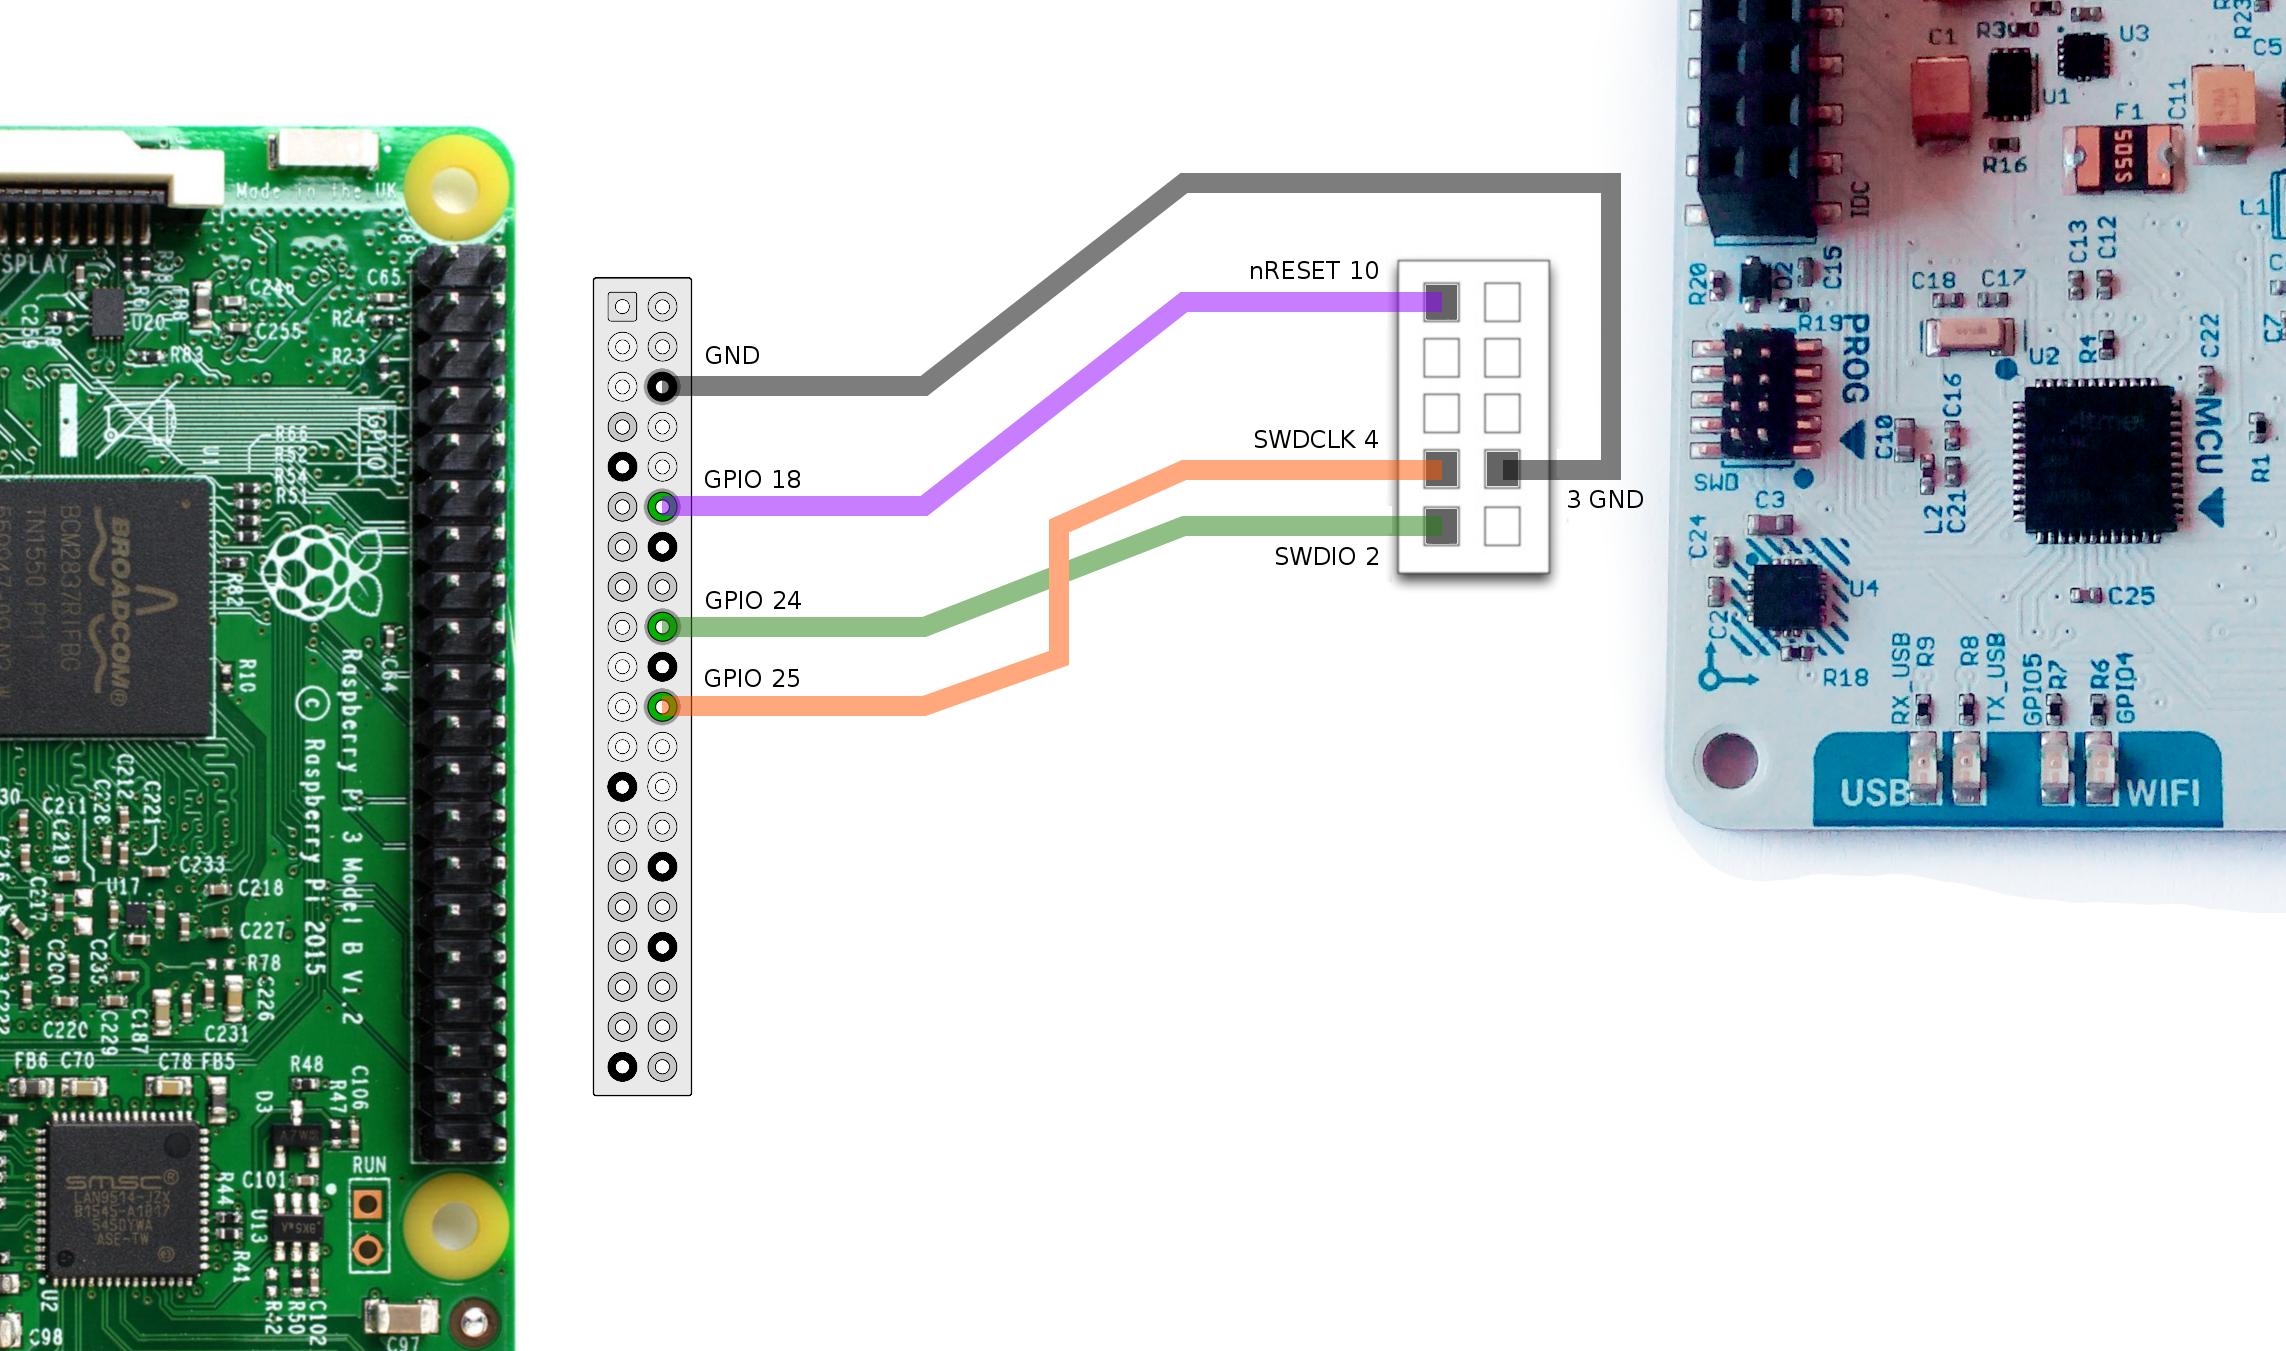
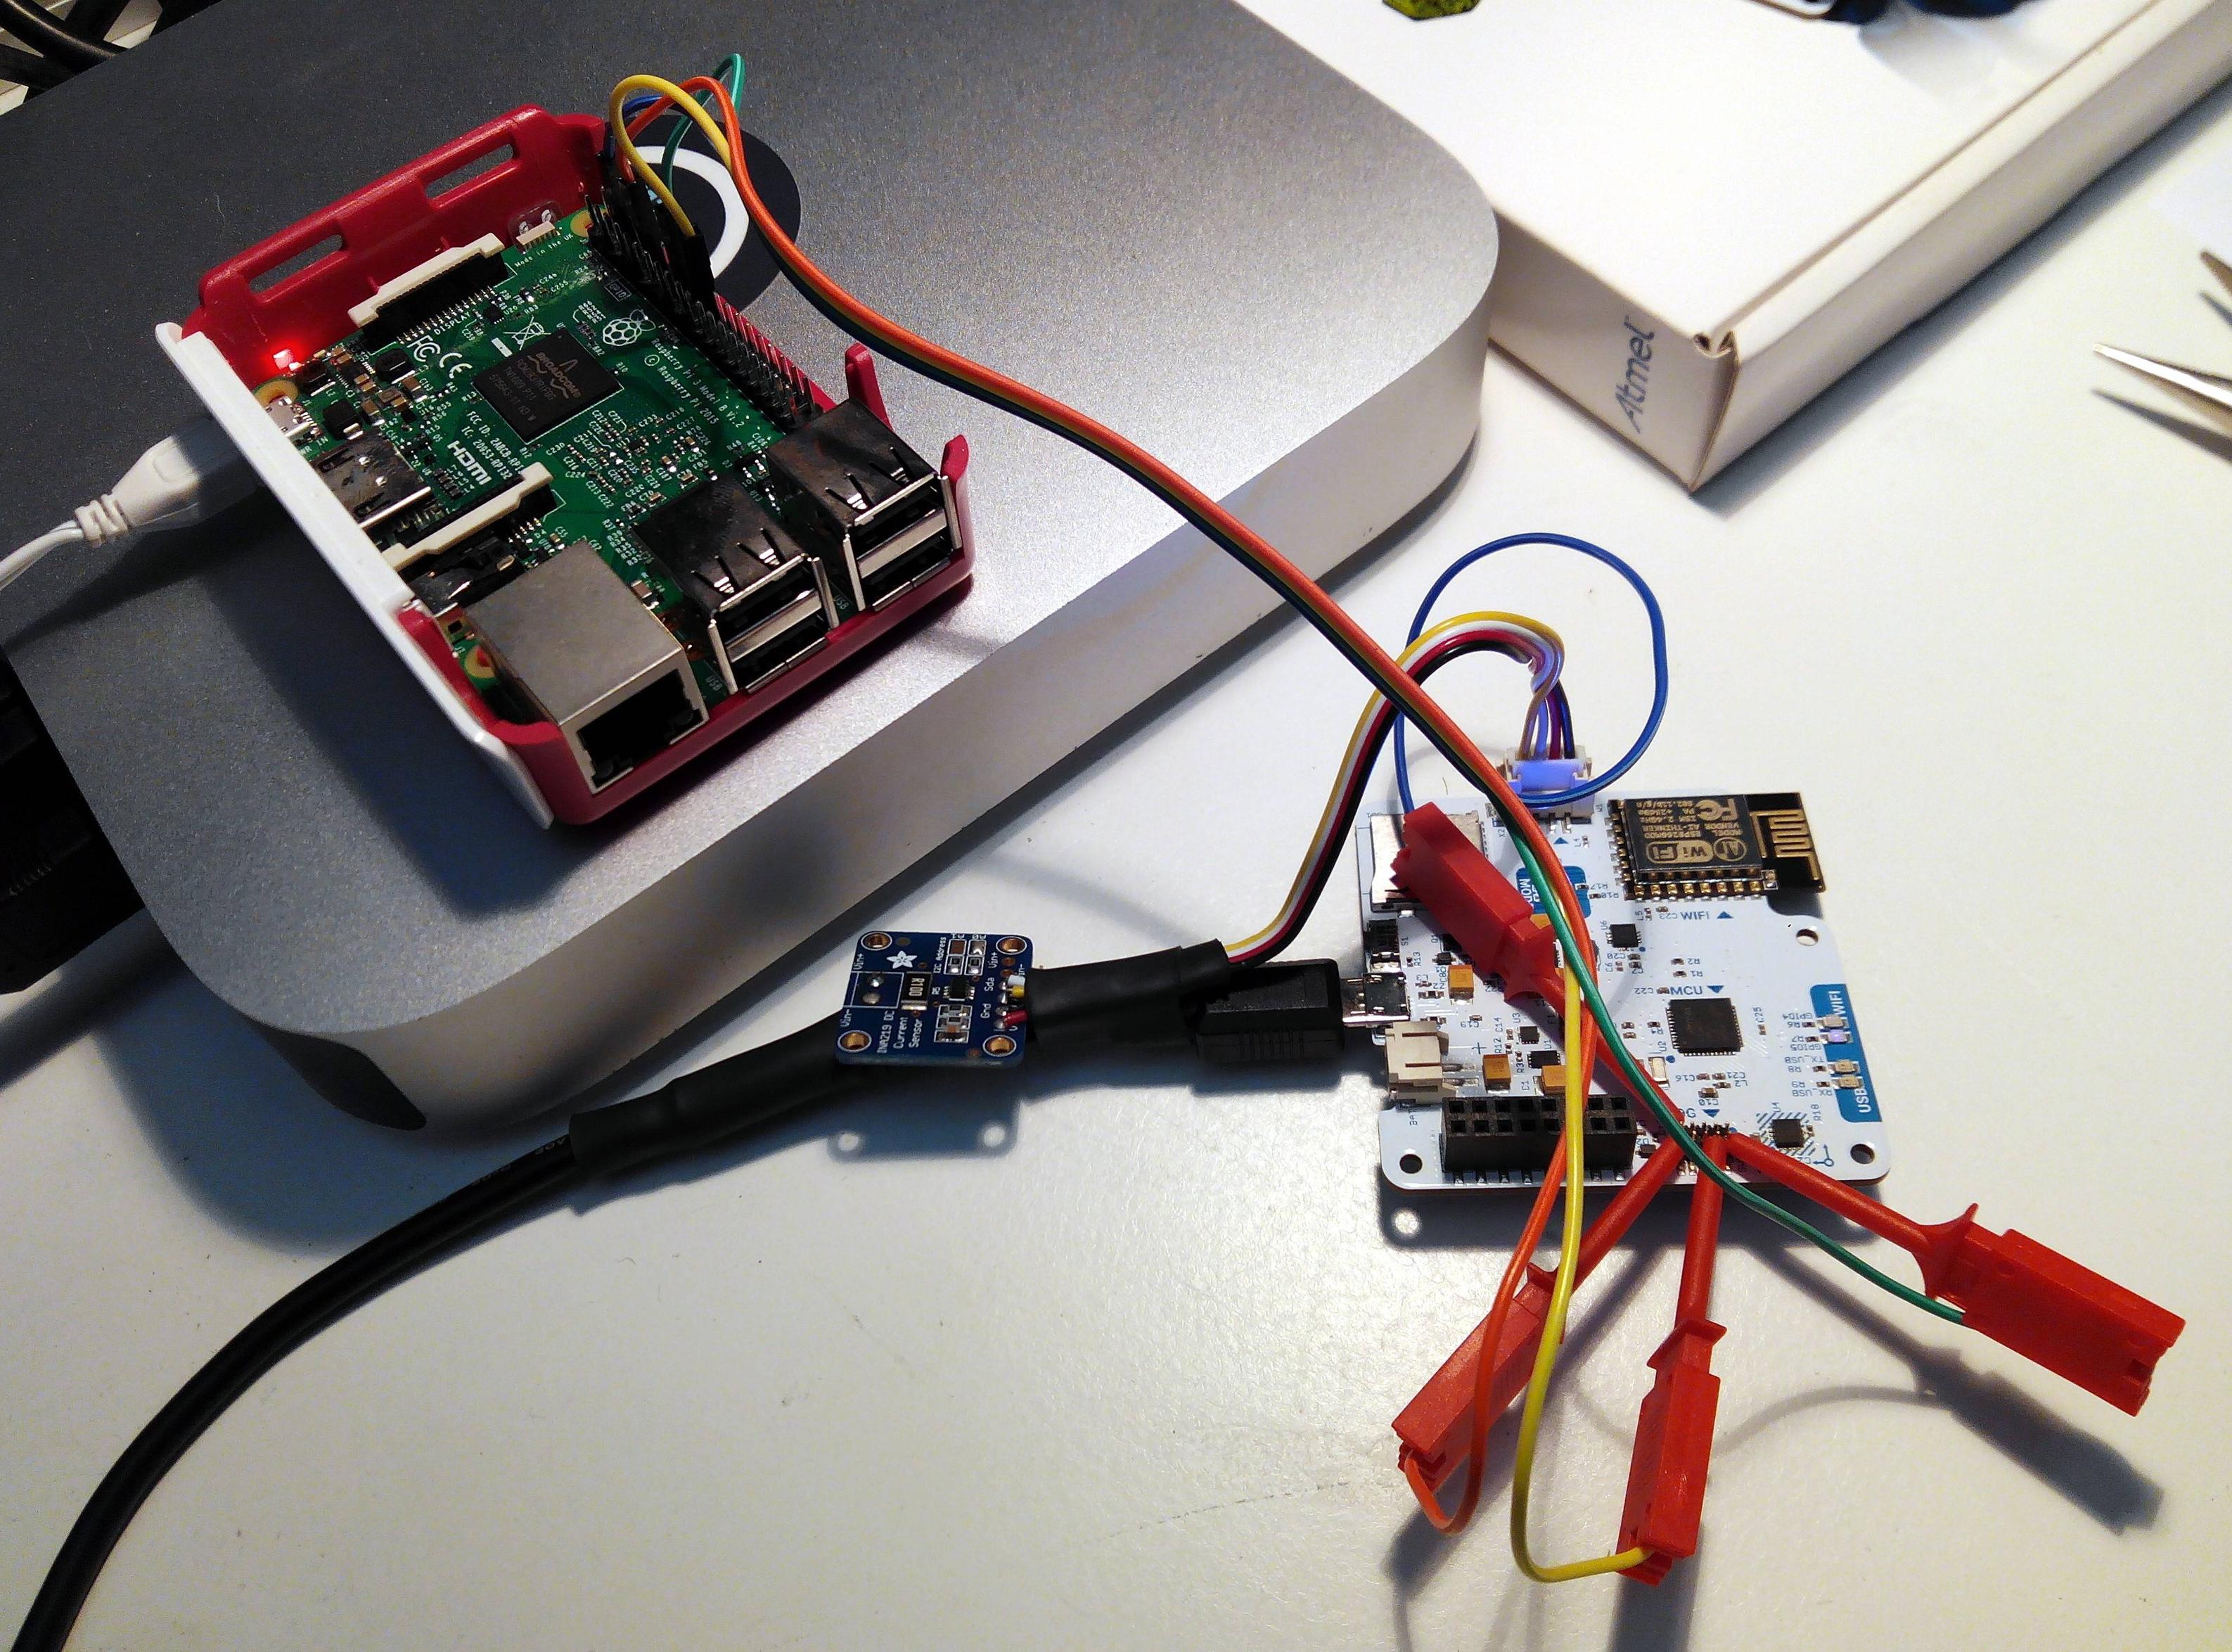
In order to use the SWD connector that the SCK features, by using Bit Banging, we connect it directly to the Raspberry Pi GPIOs:
Running OpenOCD on the raspberry pi
Once you are logged into the raspberry Pi you need a openOCD config file to start (ej. sck.cfg) with this content:
source [find interface/raspberrypi2-native.cfg]
transport select swd

set CHIPNAME at91samd21g18
source [find target/at91samdXX.cfg]

adapter_nsrst_delay 100
adapter_nsrst_assert_width 100

init
targets
reset halt
You can store this file in OpenOCD scripts dir so it will auto find it
sudo mv sck.cfg /usr/local/share/openocd/scripts/
and then run the OpenOCD server with:
sudo openocd -f sck.cfg
Then you can connect to OpenOCD, if you want to connect from an external computer, replace 127.0.0.1 with your Raspberry Pi IP address.
telnet 127.0.0.1 4444
Example
On a arduino zero go to the directory where the *.cfg is and:
openocd -f arduino_zero.cfg
Open On-Chip Debugger 0.10.0
Licensed under GNU GPL v2
For bug reports, read
    http://openocd.org/doc/doxygen/bugs.html
Info : auto-selecting first available session transport "swd". To override use 'transport select <transport>'.
none separate
adapter speed: 400 kHz
cortex_m reset_config sysresetreq
Info : CMSIS-DAP: SWD  Supported
Info : CMSIS-DAP: Interface Initialised (SWD)
Info : CMSIS-DAP: FW Version = 02.01.0157
Info : SWCLK/TCK = 1 SWDIO/TMS = 1 TDI = 1 TDO = 1 nTRST = 0 nRESET = 1
Info : CMSIS-DAP: Interface ready
Info : clock speed 400 kHz
Info : SWD DPIDR 0x0bc11477
Info : at91samd21g18.cpu: hardware has 4 breakpoints, 2 watchpoints
Using OpenOCD remotely from other computer
We need to give the OpenOCD server access to your project files that are remotely stored. To do this you can mount your working directory remotely on the Raspberry Pi via SSH:
ssh pi@raspi_address
pi$ mkdir working_dir
pi$ sshfs user@computer_address:working_path working_dir
pi$ cd working_dir
pi$ sudo openocd -f sck.cfg
telnet raspi_address 4444
Uploading Arduino original bootloader
-
Get the bootloader file here and build it.
-
Connect to OpenOCD server and run:
If you don't see any error youre done!reset halt at91samd bootloader 0 at91samd chip-erase program samd21_sam_ba.bin verify at91samd bootloader 8192 reset run
Uploading SCK Firmware
- Install platformio, download and build SCK firmware
- Connect to OpenOCD server and run:
reset halt
flash write_image firmware.bin 8192
verify_image firmware.bin 8192
reset run
reset run
GDB
General description
The purpose of a debugger such as GDB is to allow you to see what is going on “inside” another program while it executes—or what another program was doing at the moment it crashed.
GDB can do four main kinds of things (plus other things in support of these) to help you catch bugs in the act: * Start your program, specifying anything that might affect its behavior. * Make your program stop on specified conditions. * Examine what has happened, when your program has stopped. * Change things in your program, so you can experiment with correcting the effects of one bug and go on to learn about another.
Debugging session with Raspberry Pi as the OpenOCD server
Once your raspberry pi is setup with above instructions you can just do:
ssh pi@RaspberryAddress sudo openocd -f sck.cfg &
cd /platformio_project/path
arm-none-eabi-gdb ./pioenvs/zeroUSB/firmware.elf
(gdb) target remote RaspberryAddress:3333
(gdb) monitor reset run
If you are using platformio, you need to modify the compiling option to avoid optimisation with -0g message to the compiler. In case you are not using platformio, activate verbose compiling output at Arduino IDE and find your compiled .elf directory.
[env:zeroUSB]
platform = atmelsam
board = zeroUSB
framework = arduino
build_flags = -Og
Now we are all set and ready to go. The debugger is waiting for instructions on the execution, which we detail below.
Info
Quick handy instructions inside GDB environment
1. (gdb) appears in every line and you don't have to type it each time
2. In case you need to exit GDB, just type in quit, but remember always killing the process before, should you have a target running
(gdb) kill
(gdb) quit
RET repeats the previous command
GDB commands
All commands in gdb during debugging are detailed in the GDB guide, chapter GDB commands in detail (continue and stepping)
An extract of some useful commands are detailed below:
Continuing and stepping
continue [ignore-count]
- Resumes program execution until next breakpoint.
[ignore-count]argument allows to specify a further number of times to ingore a breakpoint.(gdb) continue Continuing. Breakpoint 1, tick () at src/HOLA.cpp:9 9 void tick() {
step count
- Continues running your program until control reaches a different source line, only availabe for source lines and functions compiled with debugging information.
countis optional and states the number of steps to be performed before stopping, if no breakpoint arrives earlier.
next [count]
- Continue to the next source line without going into functions. It has the same functionality as step, but it stays in the same stack frame.
countworks as instep count. As well, it understands jumps calls as in the end offorloops and return to the beginning of the loop.
Info
set step-mode on/off sets the behaviour of (gdb) when stepping into a function with no debugging information. In the case of step-mode on, it inspects the first line of code of the function, whereas on step-mode off it skips the function completely.
finish
- Continue running until just after function in the selected stack frame returns.
until
- Has the same behaviour as
step, but it ignores the jumps between lines due to loops (for, whiles, etc), continuing to the next source code with incremental line number.
Breakpoints
info breakpoints
-
Retrieve information about breakpoints
(gdb) info breakpoints
Num     Type           Disp Enb
ress    What
1       breakpoint     keep y   0x00002140 in tick() at src/HOLA.cpp:9
    breakpoint already hit 15 times
break -
Set a breakpoint in a specific function
(gdb) break loop - Set a breakpoint in a specific line (344)
(gdb) break main.cpp:344
Info
Use the tbreak command instead of break if you want to stop the program once, and then remove the breakpoint. More breakpoint condition options can be found here you can find
watchpoint
- Set a watchpoint watchpoint to only stop once a variable has a certain value.
(gdb) watch timer
Info
Type in info watchpoints to get information about watchpoints.
commands
- Set a list of actions related to the breakpoint:
break main.cpp:50
commands
silent
printf "count is %d\n",count
cont
end
delete
- Delete a breakpoint
(gdb) delete 1
(gdb) info breakpoints
No breakpoints or watchpoints.
Printing / setting variables and more
loop
- Read what is around a certain function
(gdb) l loop
25    //while (!Serial) {
26      //; // wait for serial port to connect. Needed for native USB port only
27    //}
28  }
29
30  void loop() {
31    // put your main code here, to run repeatedly:
32    Serial.println("HOLA");
33    tick();
34    Serial.println(millis());
print
- Retrieve value of a specific variable
(gdb) print timer
$12 = 2
set
- Set variable to a certain value
(gdb) set timer = 0
Target commands (load)
load filename offset
Loadit is meant to make filename (an executable) available for debugging on the remote system—by downloading it.loadalso records the filename symbol table in GDB, like the add-symbol-file command. The file is loaded at whatever address is specified in the executable, also into flash memory.
Making changes in the code
Anytime we make a change in the code, we don't need to reload the debugging session. We can easily do so by:
-
Compile the code: a. Define Shell build in Sublime Text and configure a build sytem with:
"shell_cmd": "cd .. && pio run"Then, everytime you hit Ctrl+B (Cmd+B) and you use your custom build system, it will automatically use this option.
b. Or hit
pio runin another terminal located in your project root directory -
In gdb,
loadfile. This will reload the file defined at the beginning of your debugging session and upload it to the target
(gdb) load
Loading section .text, size 0x2e50 lma 0x2000
Loading section .ramfunc, size 0x60 lma 0x4e50
Loading section .data, size 0x110 lma 0x4eb0
Start address 0x2910, load size 12224
Transfer rate: 3 KB/sec, 4074 bytes/write.
- Keep debugging
GDB Console
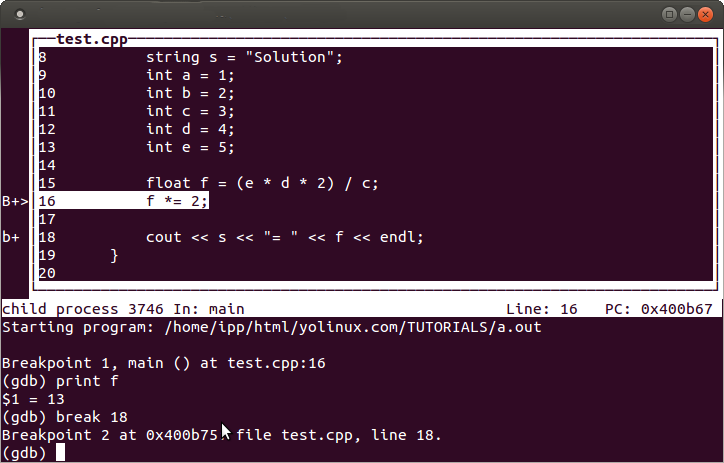
TUI
GDB has a console GUI option available with the command line option --tui In the upper frame you can see the code that's being executed.
GDB init file
From this example dashboard we can generate a custom .gdbinit file for the SCK which will be placed in the HOME directory... (ON GOING)
Info
Would be interesting to generate a custom option for production validation and one for internal debugging purposes
For references about where to locate the .gdbinit and more custom behaviour for gdb in general see here.
GDB from Sublime Text
Setup Platformio project with sublime Text Setup sublimeGDB
Reference
General GDB references and examples
Debugging example from GDB and OpenOCD
Additional notes from Platformio configuration
- How to set other DEBUG FLAGS
- About project configuration with Platformio init
- Check here for building an *.ini file with custom build target for debugging and production.