Using the Shell
The SCK (from V2.0 onwards) has an integrated command shell over USB to manage all the kits functionalities for advanced users. In this guide, we will cover how to access to this functionality in different platforms, and some examples.
What is it?
We could define the shell as a text-based interface to access almost any SCK functionality. In terms of hardware, it relies on the serial communication between the SCK and your computer, so any decent USB cable connected between them will do.
How to access it?
Software-wise, different platforms will have different interfaces. The easiest and most reliable for all of them would be through the Arduino IDE.
Using the Arduino IDE
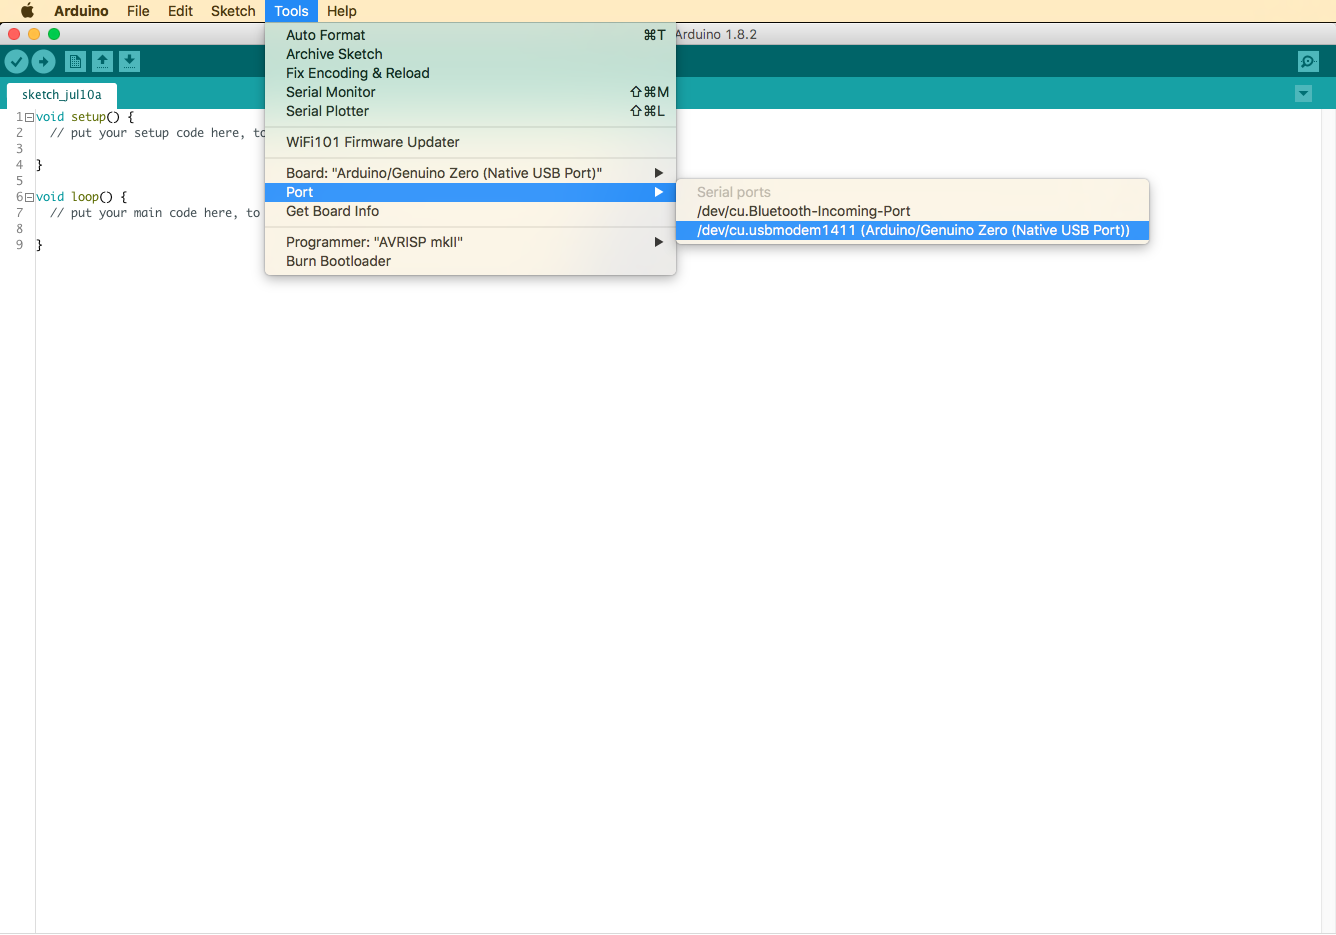
- Launch the Arduino IDE and select the port under
Tools > Port >:
-
Launch the
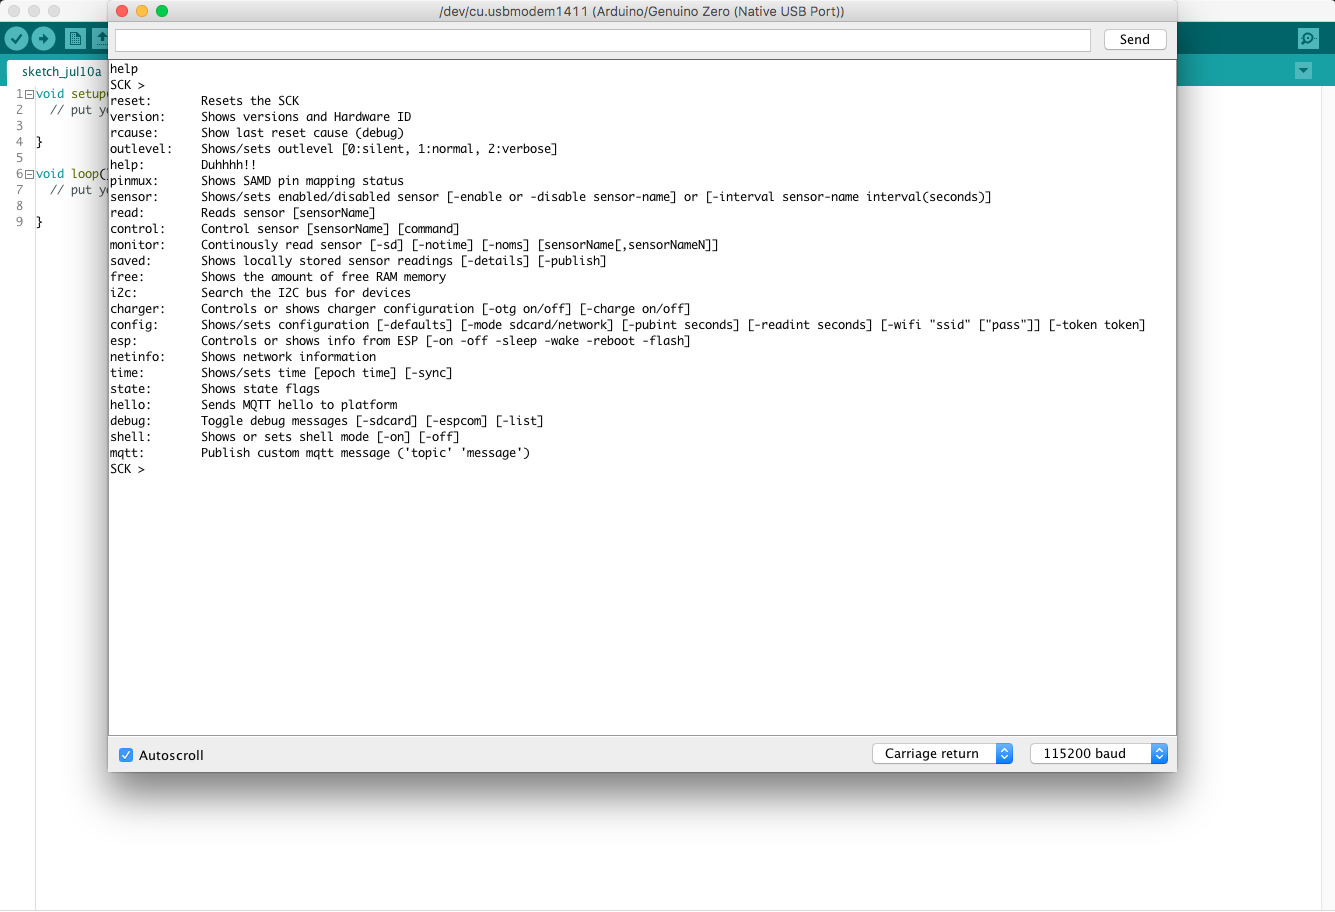
Serial MonitorunderTools > Serial Monitor. Make sure that the dropdowns in the bottom are set as in the image below (Carriage returnand115200 baud) -
Type in
helpto get started.
More advanced users would probably rather use a more rugged interface. In this case, you could use screen in your terminal of choice:
> ls /dev/cu | grep usb
cu.usbmodem1411
tty.usbmodem1411
> screen /dev/cu.usmodem1411
SCK >
...
If you already installed platformio to edit the firmware you can use it here, too
> pio device monitor
SCK >
...
Be patient!
The port will take a little time to appear in your list of devices. Normally the LED of your SCK will be static white during that period.
Some examples!
The help command outputs a quite intuitive explanation of all the commands:
SCK > help
reset:       Resets the SCK
version:     Shows versions and Hardware ID
rcause:      Show last reset cause (debug)
outlevel:    Shows/sets output level: outlevel [0:silent, 1:normal, 2:verbose]
help:        Duhhhh!!
pinmux:      Shows SAMD pin mapping status
flash:       Shows and manage flash memory state [no-param -> info] [-format (be carefull)] [-dump sect-num (0-2040)] [-sector sect-num] [-recover sect-num/all net/sd]
sensor:      Shows/sets sensor state or interval: sensor sensor-name [-enable or -disable] [-interval interval(seconds)] [-oled]
read:        Reads sensor: read [sensorName]
control:     Control sensor: control [sensorName] [command]
monitor:     Continously read sensor: monitor [-sd] [-notime] [-noms] [-oled] [sensorName[,sensorNameN]]
free:        Shows the amount of free RAM memory
i2c:         Search the I2C bus for devices
power:       Controls/shows power config: power [-info (extra info)] [-batcap mAh] [-otg on/off] [-charge on/off] [-sleep min (0-disable)]
config:      Shows/sets configuration: config [-defaults] [-mode sdcard/network] [-pubint seconds] [-readint seconds] [-wifi "ssid" ["pass"]] [-token token]
esp:         Controls or shows info from ESP: esp [-on -off -sleep -wake -reboot -flash]
netinfo:     Shows network information
time:        Shows/sets date and time: time [epoch time] [-sync]
hello:       Sends MQTT hello to platform
debug:       Toggle debug messages: debug [-sdcard] [-esp] [-oled] [-flash] [-telnet] [-speed]
shell:       Shows or sets shell mode: shell [-on] [-off]
publish:     Publish custom mqtt message: mqtt ["topic" "message"]
offline:     Configure offline periods and WiFi retry interval: [-retryint seconds] [-period start-hour end-hour (UTC 0-23)]
mqttsrv:     Configure mqtt server address and port: [-host serverName] [-port portNum]
ntpsrv:      Configure ntp server address and port: [-host serverName] [-port portNum]
Shell Mode
The SCK outputs a lot of information via serial. This can be sometimes confusing while typing commands. You can silent it a bit with this command:
SCK > shell -on
Shell mode: on
This will turn your LED static yellow, and no output except responses to your commands will be given.
Remember to turn it off after you are done experimenting!
SCK > shell -off
Shell mode: off
Set the recording configuration
If you want to change your recording mode to, for instance, sdcard mode, you could do so by typing:
SCK > config -mode sdcard
To set it up in network mode:
SCK > config -mode network -wifi "SSID" "PASSWORD" -token 123456
Warning
Note that the token is not between quotes since it's always 6 digits
To modify your wifi:
SCK > config -wifi "NEWSSID" "NEWPASSWORD"
You can check your current configuration by typing config:
SCK > config
Mode: sdcard
Publish interval: 60
Reading interval: 60
Wifi credentials: not configured
Token: not configured
Mac address:  11:22:33:44:55:66
Set recording and publication intervals
In order to understand the reading and publication intervals, it is important to describe how the structure of the measurements is done:
- Overall reading interval: base period for the SCK to take a measurement
- Individual sensor reading interval: period for each sensor to take a measurement. It is defined as N times the Overall reading interval
- Publication interval: time for the SCK to publish to the Smart Citizen Platform, independent of the reading interval.
Each of the sensors can be configured independently, with a reading interval N times the overall reading interval. For instance, after the SAM firmware V0.9.7, all the sensors are read every 60s except the PMS5003, which is read every 5 minutes or 5 times the reading interval.
In the case of the publication interval to the Smart Citizen Platform, the default is 3 minutes.
Battery calculator
This configuration option is very interesting to be used for battery saving. Make sure you check the battery calculator
All this can be configured using the shell interface. For instance, to set the publication interval to every 10 minutes, we could do:
config -pubint 600
Or to set the reading interval to every 3 minutes:
config -readint 180
Or both at 10 minutes:
config -pubint 600 -readint 600
If we want to configure one specific sensor, we can do so by typing the following, only remember, that it's rounded to the closest integer multiplier of the overall reading interval:
SCK > sensor temp -interval 360
The sensor read interval is calculated as a multiple of general read interval (180)
Changing interval of Temperature to 360
Saved configuration on eeprom!!
For instance, if we try to do 1.5 times the reading interval of the temperature sensor, we will get:
SCK > sensor temp -interval 240
The sensor read interval is calculated as a multiple of general read interval (180)
Changing interval of Temperature to 180
Saved configuration on eeprom!!
Some limitations apply though:
- The minimum reading and publish interval is 5s
- The maximum reading interval is one hour
- The maximum publish interval is one hour
For more customisation, please email or post on the forum.
Default configuration
At the moment there is no command to return to the default configuration. You should use:
config -pubint 300 -readint 60
...
sensor pm -interval 300
Get version data
Check your hardware and firmware version data with the command version:
SCK > version
Hardware Version: 2.1
SAM Hardware ID: 5934C4B550515157382E3120FF151210
SAM version: 0.9.1-30e1776
SAM build date: 2019-05-07T02:45:29Z
ESP MAC address: 86:0D:8E:A7:7F:CC
ESP version: not synced
ESP build date: not synced
List/modify the active sensors
By typing in sensor, a list of enabled and supported sensors is displayed:
SCK > sensor

Disabled
----------
PM board Dallas Temperature
[...]

Enabled
----------
Temperature (60 sec)
Humidity (60 sec)
Battery (60 sec)
Light (60 sec)
Noise dBA (60 sec)
Barometric pressure (60 sec)
VOC Gas CCS811 (60 sec)
eCO2 Gas CCS811 (60 sec)
PM 1.0 (60 sec)
PM 2.5 (60 sec)
PM 10.0 (60 sec)
To disable one sensor, you can type in part of the sensor name:
SCK > sensor Noise -disable
Disabling Noise dBA
Saved configuration on eeprom!!
To enable it, if it's present:
SCK > sensor Noise -enable
Enabling Noise dBA
Saved configuration on eeprom!!
Only if available!
If the sensor you are trying to connect is not recognised, the kit will complain:
SCK > sensor atlas -enable
Failed enabling Atlas Temperature
Read/Monitor some sensors
If one sensor is enabled, you can read it (once) or monitor it (as fast as the SCK can):
SCK > read Noise
Noise dBA: 53.85 dBA
To monitor one sensor:
SCK > monitor light
Time    Miliseconds     Light
2019-07-10T17:58:07Z    6       137
2019-07-10T17:58:07Z    98      137
2019-07-10T17:58:07Z    98      136
2019-07-10T17:58:07Z    98      137
2019-07-10T17:58:07Z    108     137
2019-07-10T17:58:07Z    98      137
2019-07-10T17:58:07Z    98      137
2019-07-10T17:58:07Z    108     137
2019-07-10T17:58:07Z    98      137
2019-07-10T17:58:08Z    98      137
2019-07-10T17:58:08Z    108     137
2019-07-10T17:58:08Z    98      136
...
Or all of them, with no arguments:
SCK > monitor
Time    Miliseconds     Battery Light   Temperature     Humidity        Noise dBA       Barometric pressure     VOC Gas CCS811  eCO2 Gas CCS811 PM 1.0  PM 2.5  PM 10.0
2019-07-11T09:13:04Z    5       37      137     28.75   57.72   1.5    101.29  1.00    408.00  1.5    1.5    1.5
2019-07-11T09:13:07Z    3195    37      138     28.78   57.65   1.5    101.30  1.00    408.00  1.5    1.5    1.5
2019-07-11T09:13:08Z    694     37      136     28.77   57.62   1.5    101.29  1.00    408.00  1.5    1.5    1.5
If you don't need to output the miliseconds column (the time since last reading) or the timestamp, you can do so by:
SCK > monitor -noms light
Time    Light
2019-07-10T17:58:58Z    136
2019-07-10T17:58:58Z    136
2019-07-10T17:58:58Z    137
2019-07-10T17:58:58Z    137
2019-07-10T17:58:59Z    136
...
SCK > monitor -notime light
Miliseconds     Light
6       137
98      137
98      137
99      137
108     137
...
Warning
If your kit has no time configured (the LED should be flashing), the output would look like:
SCK > monitor Noise
Time    Miliseconds     Noise dBA
0       1       52.83
0       187     50.36
0       187     52.05
0       187     51.95
0       187     48.28
0       187     48.72
0       187     50.81
...
Something cool to do with the monitor, is to log the sensor output into a file for later analysis. For instance, in your terminal you could do:
> echo "monitor pm light" > /dev/cu.usbmodem1411 && screen -L /dev/cu.usbmodem1411
Then, if we check the contents of the file (normally something like screenlog.X:
monitor light
Time    Miliseconds     Light
2019-07-11T09:10:05Z    6       141
2019-07-11T09:10:05Z    98      141
2019-07-11T09:10:05Z    99      141
2019-07-11T09:10:05Z    98      141
2019-07-11T09:10:05Z    108     141
2019-07-11T09:10:05Z    98      141
2019-07-11T09:10:05Z    98      141
2019-07-11T09:10:05Z    98      141
2019-07-11T09:10:06Z    98      141
2019-07-11T09:10:06Z    98      141
2019-07-11T09:10:06Z    108     141
2019-07-11T09:10:06Z    98      141
2019-07-11T09:10:06Z    98      141
...
This can be useful in case you want to log data as fast as possible, with little delay between readings (~100ms).
Changing mqtt or ntp servers
If you want to send data to your own server, or there is a firewall in your network, you can use these two commands to change them:
mqttsrv:     Configure mqtt server address and port: [-host serverName] [-port portNum]
ntpsrv:      Configure ntp server address and port: [-host serverName] [-port portNum]
Check the mqttsrv:
SCK > mqttsrv
Mqtt Host: mqtt.smartcitizen.me
Mqtt Port: 1883
Check the ntpsrv:
SCK > ntpsrv
NTP Host: ntp.smartcitizen.me
NTP Port: 80
Change mqttsrv host and port:
SCK > mqttsrv -host mqtt.greatcity.me -port 80
Mqtt Host: mqtt.greatcity.me
Mqtt Port: 80
Accessing the flash memory
This is an advanced feature and helps to explore the data stored in the onboard flash memory for debugging purposes.
Get a complete map of used sectors in the flash memory:
SCK > flash
Scanning Flash memory (it can take a while!)

0 > |u38(_/_)|u36(_/_)|u34(_/_)|u35(_/_)|u35(_/_)|u34(_/_)|u34(_/_)|u35(_/_)|u37(_/_)|u37(_/_)|u37(_/_)|u36(_/_)|u36(_/_)|u36(_/_)|u36(_/_)|u36(_/_)|u36(_/_)|u36(_/_)|u36(_/_)|u36(_/_)|u36(_/_)|u36(_/_)|u36(_/_)|u36(_/_)|u36(_/_)|u36(_/_)|u36(_/_)|u36(_/_)|u36(_/_)|u37(_/_)|u37(_/_)|u37(_/_)|
32 > |u37(_/_)|u36(_/_)|u36(_/_)|u36(_/_)|u36(_/_)|u37(_/_)|u37(_/_)|u37(_/_)|u37(_/_)|u37(_/_)|u37(_/_)|u37(_/_)|u37(_/_)|u37(_/_)|u37(_/_)|u37(_/_)|u37(_/_)|u37(_/_)|u37(_/_)|u37(_/_)|u37(_/_)|u37(_/_)|u37(_/_)|u37(_/_)|u37(_/_)|u37(_/_)|u37(_/_)|u37(_/_)|u37(_/_)|u37(_/_)|u37(_/_)|u36(_/_)|
...
Format the flash (will take a long time):
flash -format
Check a sector (see what's inside):
SCK > flash -sector 300

Sector 300 in address 1228800 is: Used
Sector 300 fully published to network: true
Sector 300 fully published to sd-card: true
Net published groups: 37
Net un-published groups: 0
Sd saved groups: 37
Sd not saved groups: 0
Total groups: 37
Freespace: 53 bytes
First group: 2021-07-08T09:04:19Z
Last group:  2021-07-12T07:34:49Z
Recover a sector (send it to the platform or save in sdcard, or both - see help command):
flash -recover all net
Advanced (but cool) example!
Making most of the digital microphone
-
The digital microphone in your SCK uses an FFT algorithm to calculate the final sound pressure level (SPL) in different scales (A, C, Z). The FFT spectrum is also available for user analysis. Let's have a look!
-
First, enable it with:
SCK > sensor fft -enable
Enabling Noise FFT
- Then, monitor and log it in a file with:
echo "monitor fft" > /dev/cu.usbmodem1411 && screen -L /dev/cu.usbmodem1411
- In this file, we will have something like:
12
15
19
20
0
...
12
23
2019-07-11T09:30:01Z    5   null
...
-
The values between the dates are the actual FFT spectrum. We will now clean the lines with the dates and then plot the data. For this, we will use a
pythoncode to make things easier. You can download the code here. -
If we run this code in
python3in the same folder where the screenlog from before is:
> python spectrum_example.py
We will have two outputs: a csv file with the spectrums in rows, and a png image that looks like this!
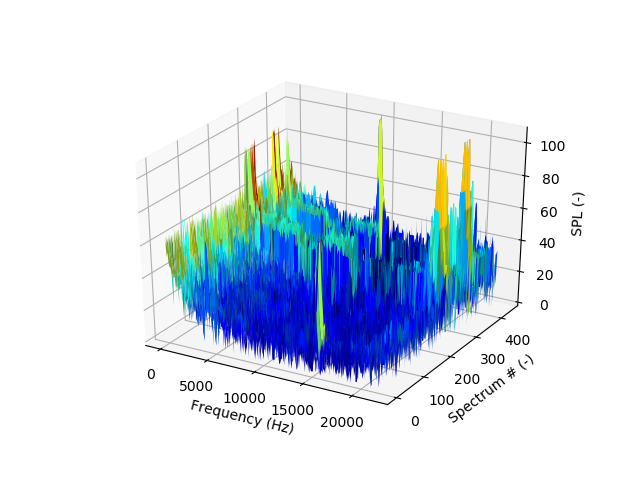
You can see that we were playing with a tone generator to make some high pitch noises at 10kHz and 20kHz.